

Key takeaways
• The software development process runs in seven phases: discovery → planning → design → architecture → development in sprints → QA → release and support. Each phase has one failure mode; skipping any of them is the fastest way to burn budget.
• Clear requirements are still the number-one success factor. A defect caught in discovery costs about 1× to fix. The same defect in production costs 60–100× (IBM Systems Sciences Institute; Boehm, 1981). Discovery is the cheapest insurance you can buy.
• Agile is the default in 2026. The vast majority of organizations now use Agile; 87% run Scrum and 56% use Kanban (State of Agile 2024). Agile projects succeed about 3× as often as Waterfall — 42% vs 13% (Standish CHAOS, 2020).
• AI-accelerated engineering is an amplifier, not autopilot. DORA’s 2025 study finds AI lifts delivery throughput but also raises instability — more change failures and rework — unless QA, review, and observability scale with it.
• Your job as a non-technical founder is oversight, not code. Attend sprint demos, protect the backlog from scope creep, and watch the four DORA metrics. That is 90% of what good product owners actually do.
Why Fora Soft wrote this playbook
Since 2005 we’ve shipped 250+ software products, from solo founders’ first apps to multi-tenant SaaS platforms like BrainCert, which a 12-person team bootstrapped to $3M in revenue, and live platforms like TradeCaster, now serving 46,000+ traders. Our teams run two-week sprints, deploy every few days, and pair senior engineers with AI coding tools. Twenty years of shipping teaches you one thing above all: the process is the product’s insurance policy.
Most founders we meet have never watched a product get built end to end. That’s fine on its own. It becomes a problem when the agency you hired quietly skips phases, hides decisions, or calls a half-built prototype an “MVP.” This is the honest version of the software development process, written so you can tell a disciplined team from a plausible one on the first call.
We start at the top of the pyramid: the full seven-phase pipeline in one glance, then how we stretch or compress it by project size, then the roles, the money, and the metrics that separate elite teams from the rest. By the end you’ll know exactly what to ask your engineering partner at every checkpoint.
Want to see this process on your product?
Book a 30-minute call and we’ll walk through the exact plan we’d run, phase by phase, from today to launch.
What are the seven phases of the software development process?
The software development process has seven phases: discovery, planning, design, architecture, development in sprints, quality assurance, and release with support. Every competent team runs this same sequence. The labels shift between shops — “inception” instead of “discovery,” “build” instead of “development” — but the phases don’t move, and neither does the order.
Here is the whole pipeline on one page, with what each phase produces and how it fails when a team rushes or skips it.
| Phase | Typical duration | Deliverables | How it fails |
|---|---|---|---|
| 1. Discovery / scoping | 1–4 weeks | Requirements doc, feature list, priority grid, rough estimate | Fuzzy specs → rework at 60–100× the cost later |
| 2. Planning & team formation | 1–2 weeks | Sprint plan, staffed team, kickoff ritual | Wrong skills → slow delivery for the whole build |
| 3. Design (UX/UI) | 2–4 weeks (overlaps) | Clickable prototype, design system, accessibility review | Late handoff to devs → expensive rebuilds |
| 4. Architecture | 1–2 weeks | Tech stack, API contract, DB schema, non-functional targets | Wrong stack → 6–12 months of drag |
| 5. Development (sprints) | 4–12 weeks (2-week sprints) | Working code, unit tests, CI passing, a demo every sprint | Unmanaged tech debt → brittle product within a year |
| 6. QA & testing | Continuous + 1–2 week hardening | Test plan, automation suite, perf report, bug log | Late QA → defects escape into production |
| 7. Release & support | 1–2 weeks + ongoing | Runbook, rollback plan, monitoring, SLA, hotfix pipeline | No monitoring → silent failures and churn |
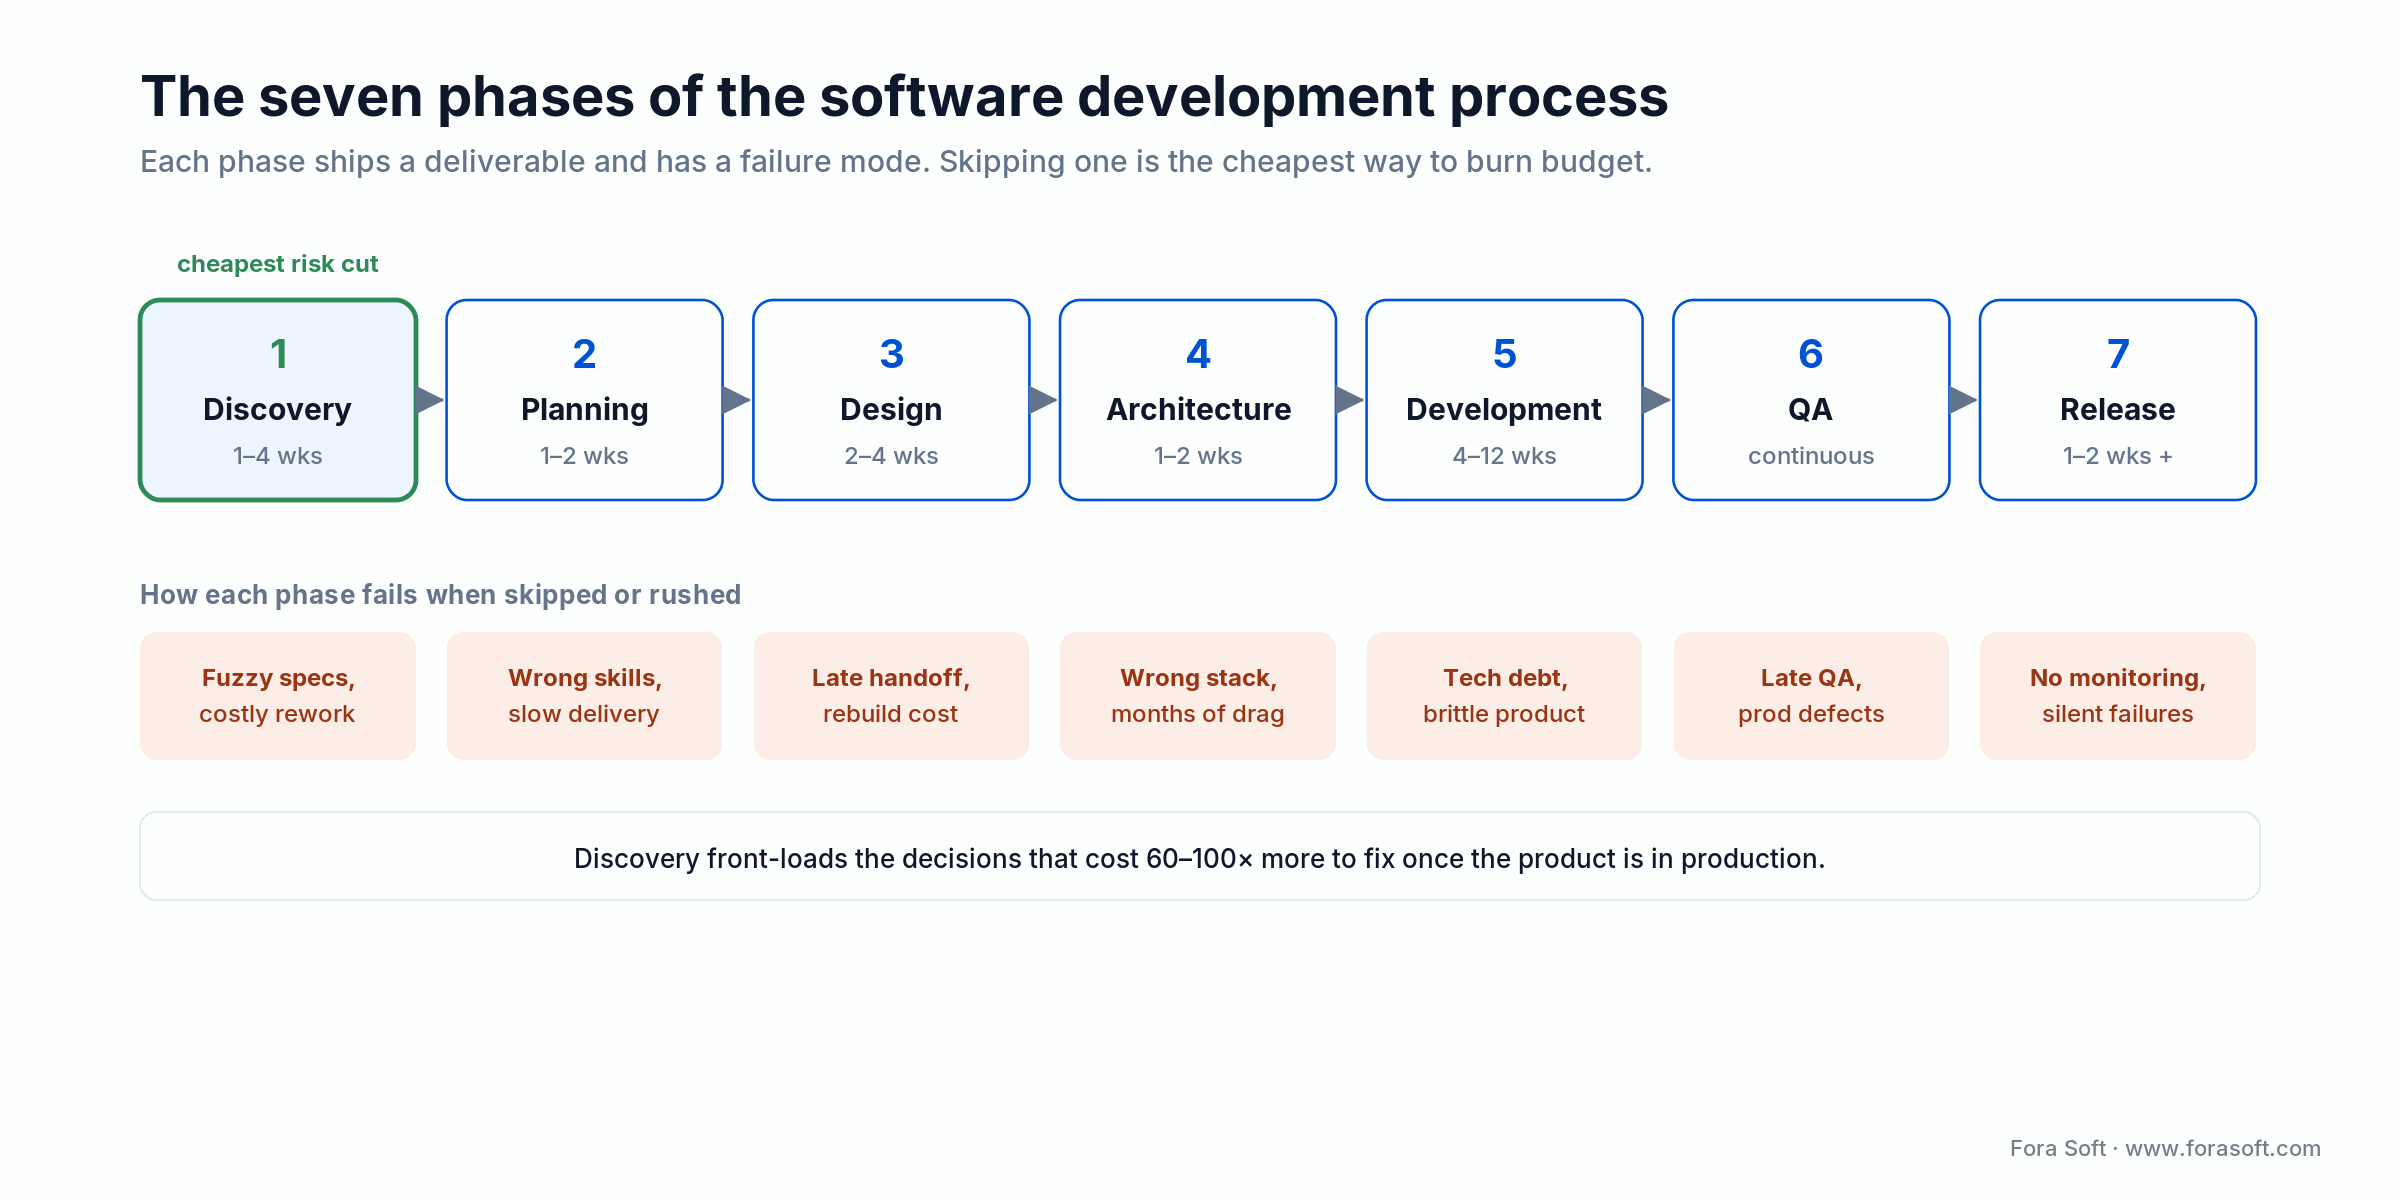
Figure 1. The seven phases run in order. Discovery front-loads the decisions that are 60–100× costlier to fix in production.
For a fast-scoped MVP these phases telescope into 3–5 calendar months. For an enterprise platform with compliance overhead they stretch to 9–14 months. We assign a weekly percentage to each phase during planning; the split is rarely even, and design plus discovery usually eat more of the front end than founders expect.
Phase 1 — Discovery: turning a napkin into a plan
Discovery is the cheapest risk reduction you can buy. It’s where “we think users need X” becomes “we measured that these five flows matter, and here’s the priced scope.” The Standish CHAOS research has said the same thing for three decades: clear requirements are the single biggest predictor of a project that ships.
The economics are brutal and well documented. A defect you catch while writing requirements costs about 1× to fix. Catch it in testing and it’s roughly 15×. Catch it in production and it’s 60–100× (IBM Systems Sciences Institute, building on Boehm’s 1981 Software Engineering Economics). That curve is the entire business case for spending real time before anyone writes code.
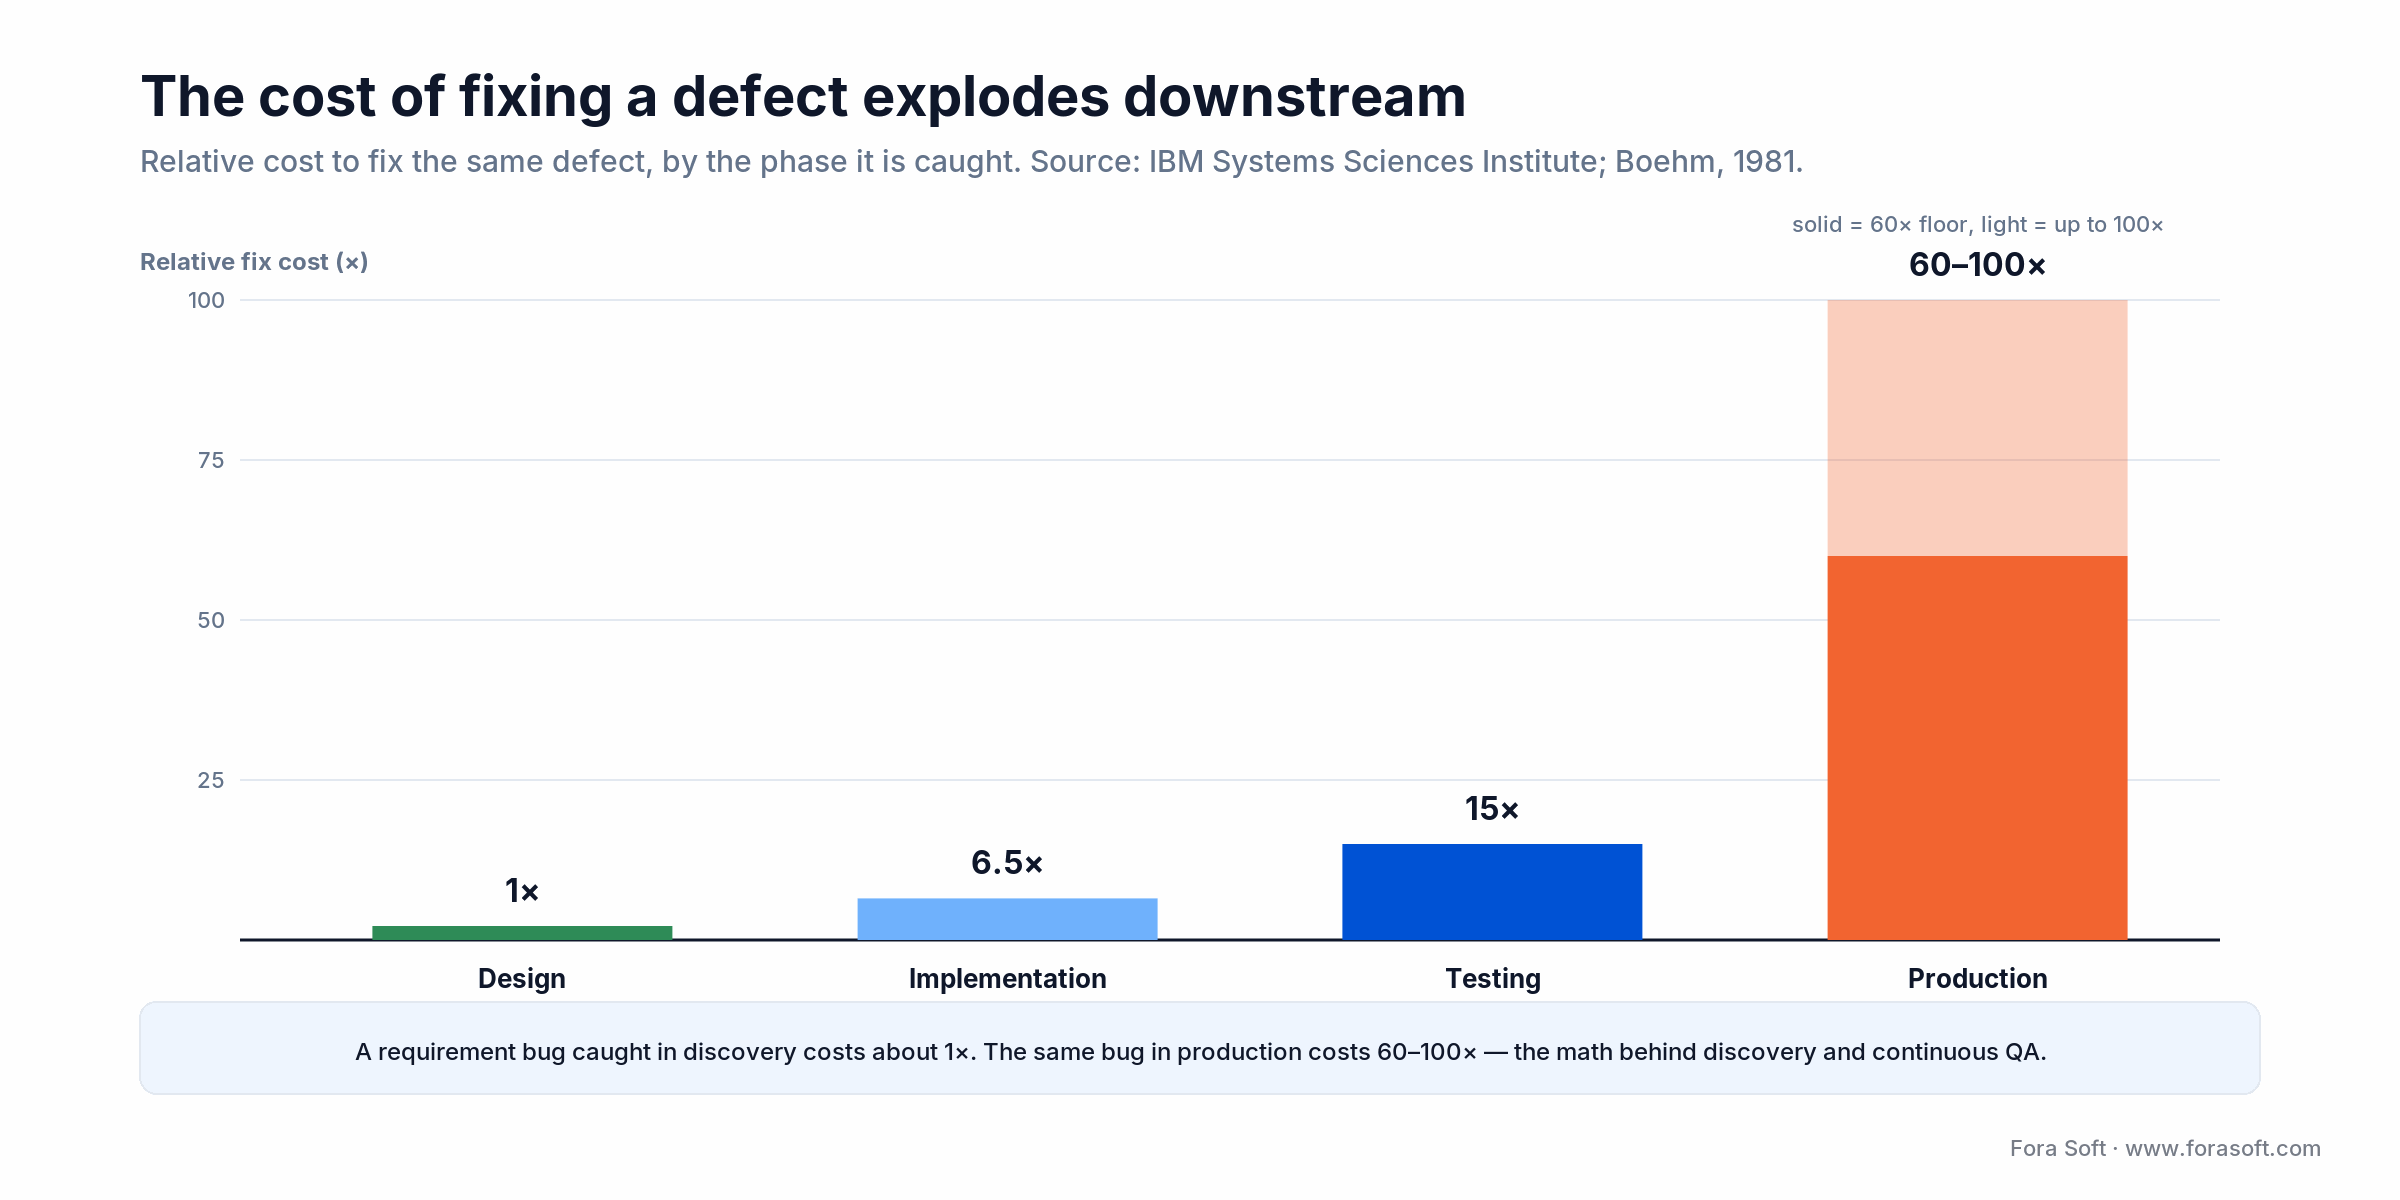
Figure 2. The same defect gets 60–100× more expensive between discovery and production. This is why we won’t skip scoping.
We run discovery in two flavours. Primary Analytics is free, takes 4–7 days, and returns a directional estimate (about ±30%) so you can make a fast go/no-go call. Comprehensive Analytics takes 2–4 weeks, is paid, and produces wireframes, user stories, and a tighter estimate (around ±15%) before you sign a fixed-price contract. Our scoping process page has the full walk-through.
Insist on these deliverables: a one-page product summary, a must/should/nice priority grid, a top-five risk log, a clickable prototype if you need investor materials, and a directional estimate with a stated band. Anything vaguer is storytelling, not discovery.
Reach for a full Comprehensive Analytics when: you’re about to commit real money on a fixed-price contract, or the product has compliance or hardware dependencies. A free Primary Analytics pass is enough to validate an idea, but you can’t lock a price against unknowns you haven’t drawn yet.
Phase 2 — Planning and team formation: the right builders, not just builders
Once scope is locked, we staff the team. A typical consumer SaaS MVP needs one PM, one business analyst, two to three full-stack developers, one QA engineer, a part-time designer, and fractional DevOps. Boston Consulting Group’s 2018 research found companies with above-average team diversity reported innovation revenue about 19 percentage points higher than homogeneous ones; we staff with that in mind, not as a slogan.
The six seats every project needs
1. Project Manager. Owns timelines, stand-ups, and stakeholder comms. This is your single point of contact. Our guide to what a technical project manager actually does breaks down the role.
2. Business Analyst. Carries requirements through from discovery so the team builds the story, not the daydream.
3. Developers. Two to five, depending on scope. A senior-plus-mid pairing beats all-senior for cost efficiency and mentorship.
4. QA engineer. Test planning, manual passes, and automation, involved from sprint one rather than bolted on at the end.
5. Designer. UX and UI for new flows, tweaks for existing ones. Often fractional after the first two months.
6. DevOps. CI/CD, infrastructure, and monitoring. Part-time for MVPs, dedicated once you scale.
Reach for a dedicated team when: the product horizon is longer than six months and you need senior people who carry domain context sprint after sprint. Staff augmentation fits a short gap or a single specialist role — the trade-offs are on our dedicated development team page.
Phase 3 — Design: why UX comes before architecture
Design pays. McKinsey’s Business Value of Design study tracked 300 companies over five years and found the top design performers grew revenue 32 percentage points faster and shareholder returns 56 points faster than their industry peers. The mechanism is simple: designing the interaction surfaces data and flow decisions that quietly reshape the architecture. Build the architecture first and every design surprise becomes rework you’re paying for at 15× or more.
Our design pass produces wireframes first (20–40 screens, depending on scope), then a clickable prototype, then the visual system in Figma. We check accessibility against WCAG 2.2 at the prototype stage, not after launch, because retrofitting contrast and focus order into shipped screens is its own small project. Designers sit in sprint planning the whole way through.
Phase 4 — Architecture: the decision that compounds for years
The stack and architecture choices made in week three shape your cost structure for years. Pick the wrong database or deployment model and you can add six figures of avoidable spend and months of rework before anyone notices.
Stack choice. We bias toward boring-and-proven: TypeScript with React or React Native on the client, Node.js or Python on the server, PostgreSQL as the primary database, Redis for cache, and S3-compatible object storage. For AI features we put a small Python service in front of open models (Llama, Whisper) or a thin wrapper over the OpenAI and Anthropic APIs, which is also where our AI integration work usually starts.
Infrastructure. Docker containers, orchestrated with Kubernetes for stateful platforms and serverless (AWS Lambda, Google Cloud Run) for bursty workloads. Most MVPs start on a single managed host such as Hetzner or DigitalOcean and migrate to multi-region only when traffic actually demands it.
Non-functional requirements. Set performance budgets, availability targets (99.5% or 99.9%), data residency, and compliance class (GDPR, HIPAA, PCI DSS, SOC 2) now. Retrofitting these onto a running system is painful and slow; the architecture phase is where they get baked in cheaply.
Reach for a microservices split when: distinct parts of the product scale independently or ship on separate cadences. Until then a well-structured monolith is cheaper to build, test, and debug — premature service boundaries are one of the most expensive fashion choices in this industry.
Phase 5 — Development in sprints: the rhythm that ships products
Development isn’t a monolith; it’s a rhythm of two-week sprints, the dominant cadence for Agile teams (State of Agile 2024). Each sprint opens with planning, closes with a demo, and holds a fixed backlog in between so the team can finish what it commits to instead of chasing a moving target.
A two-week sprint in our shop
Day 1 — Planning. Backlog refinement, story sizing, and a capacity check. The team commits to a realistic sprint scope, following the Scrum Guide events rather than inventing ceremonies.
Days 2–9 — Build. A daily 15-minute stand-up, feature branches, pull requests reviewed by a peer and usually by an AI reviewer, automated tests in CI, and QA exploring features as they land.
Day 10 — Demo and retro. Built features shown to the client in a 30–45 minute call. The retro is short, specific, and blameless: what do we change next sprint?
This cadence isn’t ritual for its own sake. It creates the predictable delivery rhythm that the four DORA metrics — lead time, deploy frequency, change-failure rate, and time to restore — are built to measure.
Comparing agencies or team structures?
We’ll look at your draft plan on a 30-minute call and flag the staffing, sprint cadence, or tooling decisions most likely to burn budget.
Agile, Waterfall, and the hybrid truth
In 2026 Agile is the default, not the exception: the vast majority of organizations use it to some degree, 87% run Scrum, and 56% use Kanban for ops and support (State of Agile 2024). The outcome gap is real. Standish CHAOS 2020 put Agile project success at 42% versus Waterfall’s 13% — about three times as often. Broken out by project size, CHAOS resolution data shows Agile’s edge widening as builds get bigger. Agile wins not because it’s magic, but because it forces conversation and feedback before a wrong assumption compounds for six months.
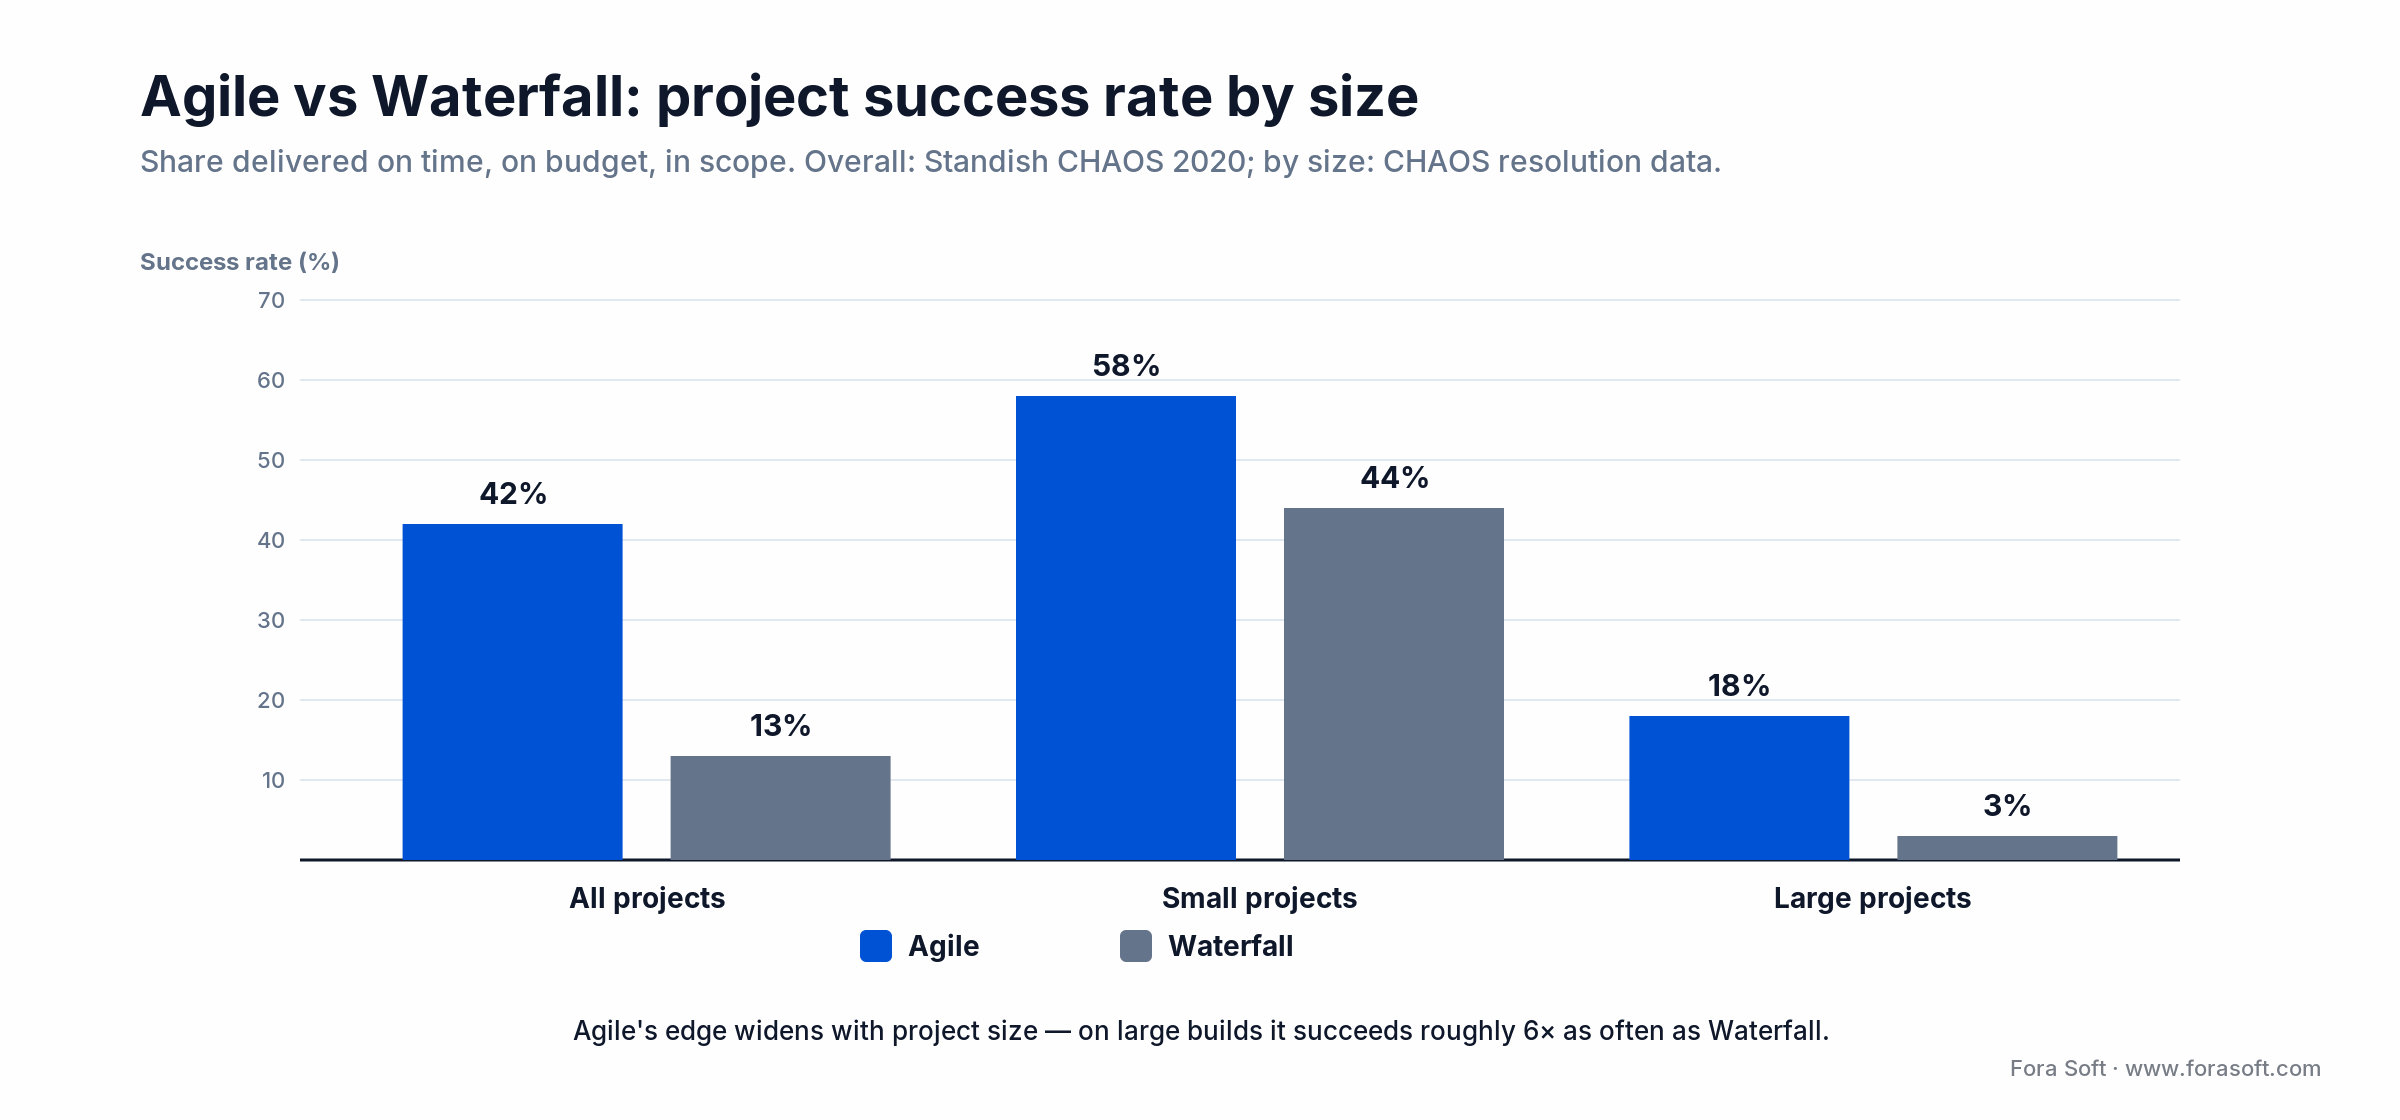
Figure 3. Agile’s success advantage grows with project size. Overall rates: Standish CHAOS 2020; by-size split: CHAOS resolution data.
Pure Scrum. Fixed two-week sprints, daily stand-ups, demo and retro cadence. Best for product teams building new features against a roadmap.
Kanban. No fixed iterations; work flows across a board with work-in-progress limits. Best for support queues, incident response, and small focused teams.
Shape Up. Six-week cycles with appetite-driven scope. Niche but growing in startups where leadership wants fewer status checks and more autonomy.
When Waterfall still wins. Regulated work with fixed sign-offs — medical-device approval, certified financial software, hardware integrations. Even there we run Agile inside the Waterfall phases; it’s cheaper than it looks and keeps the feedback loop alive.
Reach for Kanban over Scrum when: the work is unpredictable and interrupt-driven — a support desk or an on-call rotation — where fixed sprint commitments would just be broken every week. Keep Scrum for roadmap feature work with a stable backlog.
Phase 6 — Quality assurance: continuous, not bolted-on
QA has moved from a gate at the end of the pipeline to a continuous discipline. Modern CI runs unit, integration, and end-to-end tests on every pull request; feature branches get previewed in throwaway environments; security scans and accessibility checks run in the same pipeline. The point is to find defects while they still cost 1× to 15×, not 60×.
Our targets: 70%+ test coverage on critical paths, a change-failure rate under 5%, and mean time to restore under an hour after a production incident. Those are the kind of numbers DORA associates with elite performers, and they’re reachable with disciplined sprints rather than heroics.
For the deeper version of this topic, our software testing guide breaks down the test pyramid and the automation return on investment.
Phase 7 — Release and support: ship early, ship often
Release cadence is a competitive advantage now. DORA’s elite performers deploy on demand — often many times a day — while lower performers ship once a month or less. Etsy was bragging about 50-plus deploys a day more than a decade ago; the tooling that made that exotic then is table stakes today. A healthy mid-size product team should target at least one deploy a week in sprint mode, and more once the pipeline is trusted.
Deployment patterns we use
Blue-green. Two identical environments; cut traffic from blue to green instantly and roll back in seconds. Our default for zero-downtime releases.
Canary / progressive. Release to 5–10% of traffic, watch the error rate for 5–30 minutes, then expand in stages. Standard for high-traffic consumer products.
Feature flags. Deploy code dark and switch it on per user segment. This decouples “ship the binary” from “launch the feature.” LaunchDarkly, Unleash, and ConfigCat are the common managed options.
Observability. Metrics, logs, traces, and error tracking through tools like Sentry, Datadog, Grafana, or OpenTelemetry. Without them, production failures go silent until a customer emails you.
AI-accelerated engineering: the 2026 baseline
The biggest change since 2022 isn’t the methodology; it’s that engineers now work beside AI coding assistants, AI reviewers, and spec-driven agents. In DORA’s 2025 State of AI-assisted Software Development, 90% of developers report using AI daily. GitHub’s controlled study found developers finished one benchmark task 55% faster with Copilot (a single lab task, not a blanket speed-up). McKinsey’s lab work is more nuanced: documentation and fresh code get done in roughly half the time, but the gains shrink below 10% on complex, unfamiliar work, and junior developers sometimes run 7–10% slower with the tools than without them.
DORA’s headline for 2026 is the one to internalize: AI is an amplifier. It correlates with higher throughput, but that speed also correlates with more instability — higher change-failure rates and more rework — unless the team already has strong delivery foundations. Thoughtworks says the same thing in its Technology Radar (Vol. 34, April 2026), where nearly half the entries are AI-related and the standout warnings are about “cognitive debt” and unreliable agents.
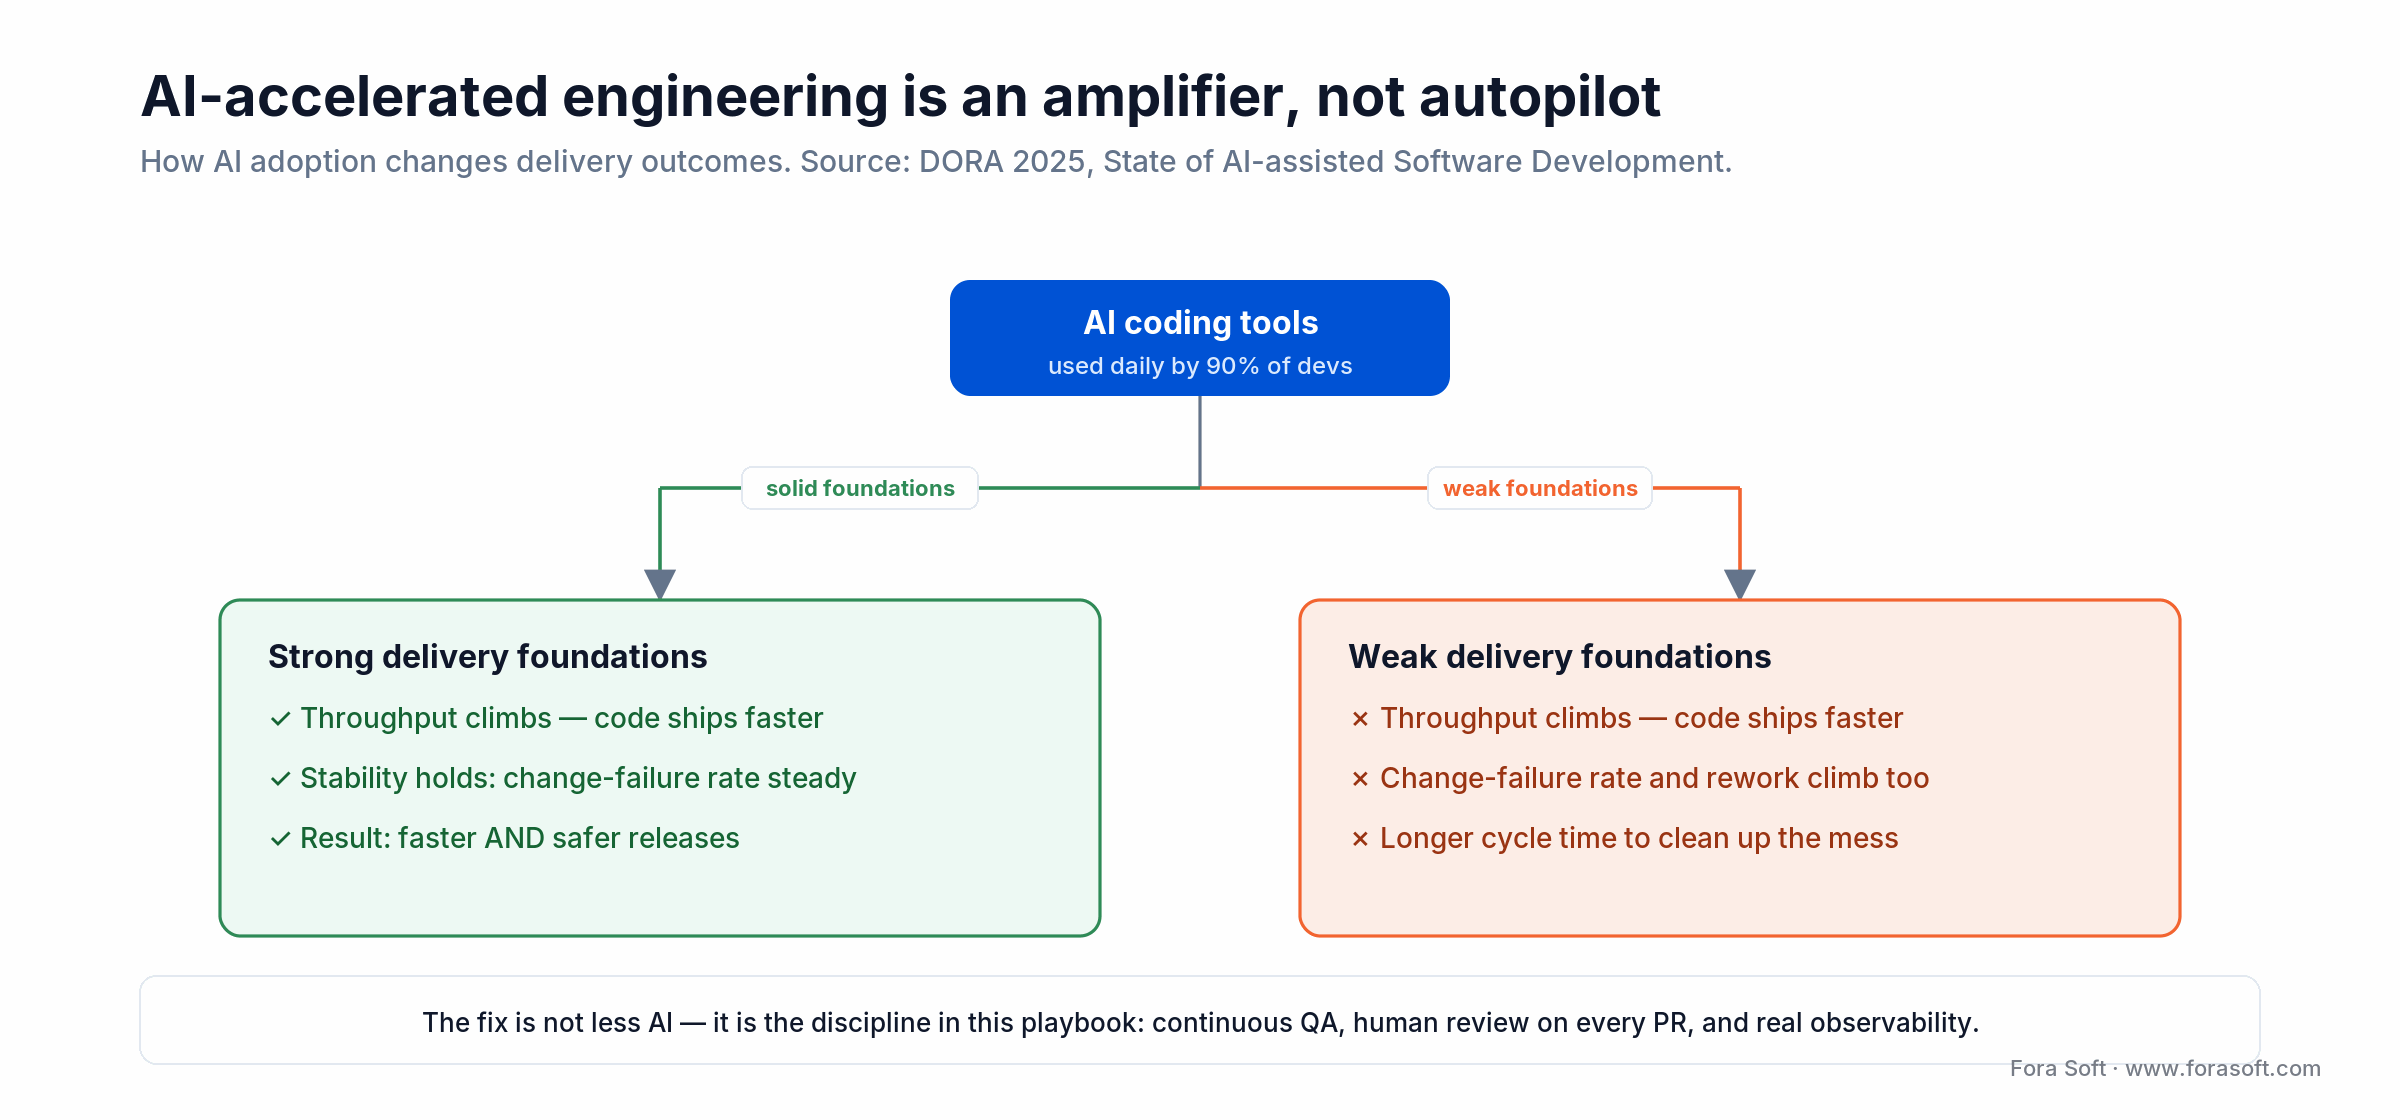
Figure 4. AI amplifies whatever culture it lands in. On solid foundations it’s an accelerator; on weak ones it magnifies the chaos (DORA 2025).
How we use it. An AI pair-programmer in the IDE for boilerplate and refactors, spec-to-code agents for large rewrites, an AI reviewer on every pull request catching test gaps, and automated test generation from specs. It’s the same discipline we teach in our AI-for-engineering learning track, where our team documents how these tools hold up on real production work.
What it is not. It’s not autonomous shipping, not a replacement for senior review, and not a license to drop the design or QA phases. Teams that went all-in on “let the AI decide” are the ones DORA and Thoughtworks flag for rising rework. We stay human-in-the-loop on every decision that touches production.
What a build actually costs: a worked estimate
Two numbers decide your budget: how the hours split across phases, and how wide the estimate band is. Here’s roughly where the effort goes on a typical cross-platform MVP, before support.
| Phase | Share of MVP effort | What drives it up |
|---|---|---|
| Discovery | 5–10% | Compliance, integrations, unclear users |
| Design | 10–15% | Screen count, custom interactions |
| Architecture | 5–10% | Real-time, scale, data residency |
| Development | 45–55% | Feature count, third-party APIs |
| QA + release | 15–20% | Test automation, uptime targets |
Now the band. Say discovery prices a build at $120,000 with a ±15% estimate. You budget $102,000 to $138,000 — a range you can actually plan against. Price the same build off a sales call at ±40% and you get $72,000 to $168,000. That’s not an estimate; it’s a coin flip with a spreadsheet. Skipping scoping entirely is worse: unscoped projects routinely blow past budget and timeline. The math is why we won’t quote a fixed price before a real scoping pass.
Then plan for the part founders forget. Budget 15–25% of the initial build cost per year for maintenance, security patches, and small features. On that $120,000 build, that’s $18,000 to $30,000 a year to keep the product healthy — not optional, and cheaper than the emergency rewrite that follows neglect. Our software estimating guide and app cost breakdown go line by line, and our custom software development service page shows how we scope fixed budgets.
One honest note on our own pricing: we use AI-assisted engineering to compress delivery, so our estimates tend to come in faster and leaner than a same-scope quote from a traditional shop. We’d rather under-promise a number and beat it than pad one to look safe.
Mini case — BrainCert, bootstrapped to $3M
Situation. BrainCert started as a lean virtual-classroom MVP. To compete with VC-backed learning platforms, the founder needed multi-tenant SaaS, HD WebRTC classrooms, LTI integrations, and a self-serve billing funnel — none of which the MVP had, and all without outside funding to spend on mistakes.
The plan. We ran a Comprehensive Analytics phase, staffed a small dedicated team, and moved to two-week sprints with fixed demo days. Architecture was rebuilt for multi-tenant isolation with row-level security; WebRTC and HTML5 replaced the legacy media path; CI/CD went from weekly to daily with blue-green deploys; and a feature-flag system let the business roll features out to specific schools without an engineering ticket. It looked exactly like the seven phases above, run without skipping any of them.
Outcome. BrainCert grew to $3M in annual revenue in 2024 — up 58% year over year, and roughly double its $1.5M in 2021 — serving 100,000+ customers and delivering 500M+ real-time classroom minutes across ten datacenters at 99.995% uptime — with a 12-person team and zero outside capital. Our portfolio has 250+ more builds that followed the same discipline. Want a similar assessment of your product? Book a 30-minute scoping call.
Your role as a non-technical founder: five habits
1. Attend sprint demos. Every two weeks, 30–45 minutes. Bring three questions, one piece of feedback, and one business update. Miss the demos and you lose the feedback loop that makes Agile work.
2. Protect the backlog. Every “oh, and also” gets sized against the priority grid from discovery. If it beats something already committed, something else comes out. If it doesn’t, it waits for the next sprint.
3. Read the DORA metrics monthly. Lead time, deploy frequency, change-failure rate, time to restore. You don’t have to run them, just know which way each is trending.
4. Review the risk log quarterly. Every project keeps a live top-five risk list. If it never changes, the PM isn’t doing the work; if it changes every week, the scope is unstable.
5. Stay close to users. Run user interviews every six weeks. The team can only build what you tell them to; without fresh signal, they build last quarter’s plan.
Need a sanity check on your current process?
We audit engineering processes as a friendly second opinion, no contract required. If there’s a gap, we’ll tell you. If there isn’t, we’ll tell you that too.
Five pitfalls that wreck software projects
1. “Let’s just start coding.” The single biggest predictor of failure. A seven-day discovery pass saves months. Standish CHAOS has made this point for thirty years and the data repeats every year.
2. Sales-driven estimates. When a salesperson commits to a timeline before engineers sign off, the project is already late. Require the estimate to be authored by the team that will build it.
3. QA at the end. Testing added after the fact finds more defects, later, at higher cost. Wire QA into sprint one, even before the product has users.
4. No observability in production. If you can’t see errors, latency, and usage, you’re running blind. A basic Sentry-plus-dashboard setup costs less than a week of engineer time and pays back monthly.
5. Scope creep without a grid. Changes are fine; changes without a priority-grid trade-off are poison. Every new request should push something out of the sprint or wait for the next one. Our cost-cutting notes cover the patterns that actually save money.
KPIs that separate elite teams from average ones
Quality KPIs (DORA). Lead time from commit to production under 24 hours; deploy frequency at least weekly, ideally daily; change-failure rate below 5%; mean time to restore under one hour. Elite teams hit all four at once.
Business KPIs. Sprint commitment versus completion above 85%; estimate accuracy within 15% after discovery; backlog health with no stale items older than 90 days; cost per feature flat or trending down quarter over quarter.
Reliability KPIs. p95 API latency under 500ms; crash-free sessions above 99.5%; database CPU below 70% at peak; error budget honoured with SLO breaches tracked. Teams that hit these in year one rarely slip in year three.
When not to build software from scratch
Not every problem is a software project. If the workflow fits a template in Airtable, Notion, or a no-code platform, use that. If the capability lives in an existing SaaS product such as HubSpot, Salesforce, or Shopify, configure it rather than rebuild it. Custom software earns its keep when it becomes your competitive edge, not your to-do list.
Skip a bespoke build when the audience is under a few hundred users and monetisation is unproven, when three off-the-shelf tools stitched together already solve it, or when there’s no budget for the first twelve months of support. Software is an ongoing cost centre; build only when the business case survives a skeptical quarterly review. This tree is how we route that decision with clients.
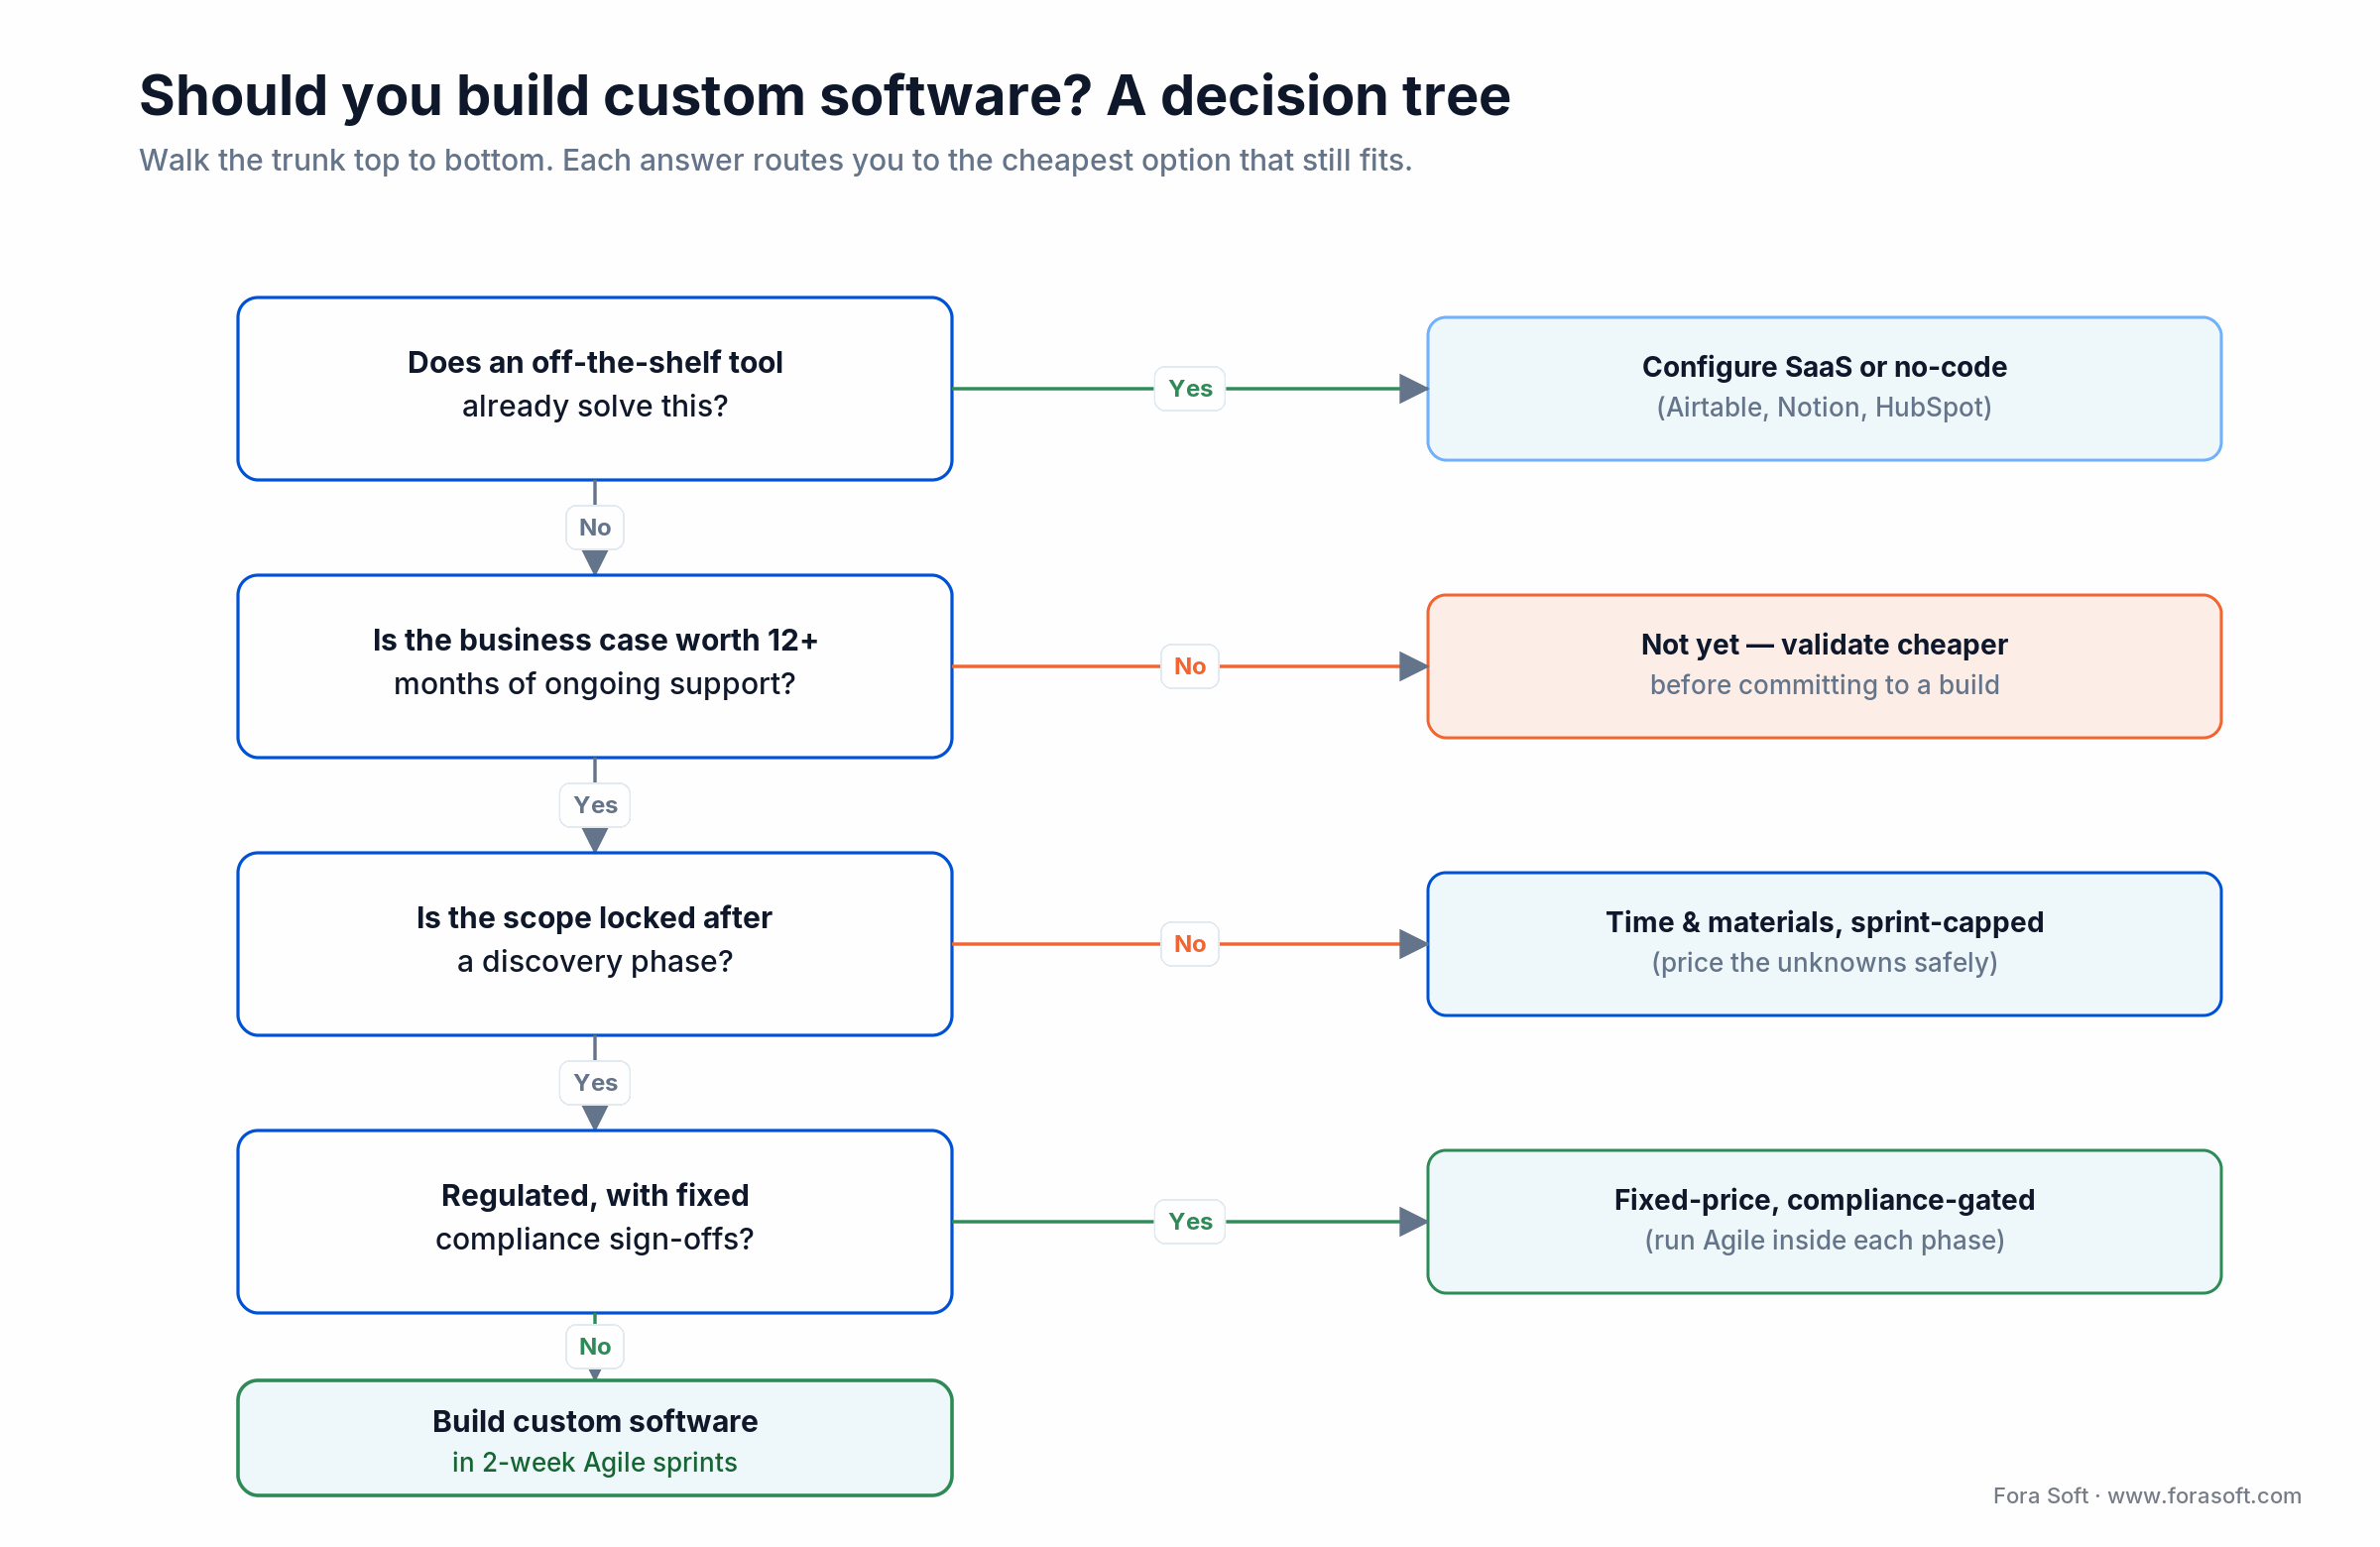
Figure 5. Walk the trunk top to bottom. Each answer routes you to the cheapest option that still fits the problem.
FAQ
What are the stages of the software development process?
Seven: discovery, planning and team formation, design, architecture, development in sprints, quality assurance, and release with support. Every competent team runs this sequence; only the labels change. Skipping a stage doesn’t save time, it moves the cost downstream where it’s 60–100× higher.
How long does a typical software project take?
A lean MVP runs 3–5 months. A cross-platform MVP with subscription billing and an admin panel runs 5–8 months. A scale-ready product runs 9–14 months. Anything shorter is usually a prototype; anything longer is usually scope creep.
Agile or Waterfall — which should we use?
Agile for almost everything: Standish CHAOS 2020 puts its success rate at 42% versus Waterfall’s 13%. Use Waterfall-style gating only for regulated work with fixed compliance sign-offs, and even then run Agile inside each phase to keep the feedback loop alive.
Should we go fixed-price or time-and-materials?
Fixed-price works only after a Comprehensive Analytics phase has locked the scope. Before that, you’re asking a vendor to price unknowns, which they’ll pad by 30–50%. Time-and-materials with a sprint cap is usually cheaper and faster for early-stage builds.
Do we need a CTO before hiring an agency?
No. You need a PM who can translate engineering updates into business terms. A part-time technical advisor (2–4 hours a month) is usually enough for the first year. A full-time CTO makes sense once headcount crosses ten engineers or you take institutional investment.
What’s the difference between an MVP and a prototype?
A prototype tests whether a design feels right; it has no real backend or billing and takes weeks. An MVP is a real product with the minimum feature set needed to win paying users, and it takes months. Calling a prototype an MVP is the most common way agencies oversell early work.
How do we know if our agency is any good?
Five signals: they run a real discovery phase (not a sales pitch), they demo every sprint, they share DORA metrics monthly, they have a named QA person on the team, and their risk log actually changes over time. Missing two is a yellow flag; missing four means interview replacements.
How accurate are software estimates, really?
About ±30% after a quick scoping pass and around ±15% after a full Comprehensive Analytics. Without any scoping, overruns are common and large. The band matters more than the midpoint — a tight band is what you budget against.
Does AI replace the need for senior engineers?
Not yet, and not soon. AI raises throughput on boilerplate, refactors, and test generation, but it also raises change-failure rates when nobody senior reviews the output. DORA 2025 and Thoughtworks Radar both flag the same risk. Senior engineers remain the bottleneck and the safety net. What happens after launch is support at roughly 15–25% of build cost per year, covered by our maintenance service.
What to Read Next
Scoping
Primary Analytics — a 7-Day Scoping Pass
The discovery method that feeds the seven-phase pipeline.
QA
The Importance of Testing in Software Development
The test pyramid, automation ROI, and the elite-team bar.
Estimation
A Founder’s Guide to Software Estimating
How we price scope before writing a single line of code.
Cost
Mobile App Development Costs Guide
Line-item budgets and the levers that actually move them.
Team
What a Technical Project Manager Actually Does
The role that protects scope, schedule, and sanity.
Ready to build software the disciplined way?
Software gets built in seven phases. Skip them and the statistics catch up with you: most projects come in challenged or failed, unscoped builds blow past budget, and codebases rot into rewrites. Run them in order — discovery first, QA from day one, release early and often, AI-accelerated but human-reviewed — and the odds flip in your favour.
Our job as your engineering partner is holding that discipline when the pressure is on to cut corners. Twenty years and 250+ shipped products have taught us where those corners hide. If you want a team that ships fast and ships well, a 30-minute kickoff call is the quickest way to find out whether we fit.
Let’s map the seven phases onto your product
Bring your current plan, or a napkin. In 30 minutes we’ll come back with the phase-by-phase shape of the work ahead.

