


Key takeaways
- Software cost estimation is the practice of forecasting the money, time and risk a software project will take, expressed as a range with a stated confidence. It is a decision tool, not a deadline: a good software cost estimate surfaces the cheapest path to a product you can sell. It does not predict the future to two decimal places.
- Accuracy is bought with scope locks, not with hours. The Cone of Uncertainty shows early estimates can legitimately land anywhere from 0.25× to 4× — a 16× spread that only narrows as decisions get signed.
- Stack at least two methods, never one. Analogous for the pitch, bottom-up plus 3-point PERT for discovery output, Planning Poker every sprint. Any single number from any single method is wrong.
- The best contract is a paid discovery, then a fixed build. Time-and-materials for the first 2–4 weeks to compress the cone, fixed-bid with change-order discipline for the rest. Pure fixed-bid on a blank page is how projects join the roughly half Standish calls challenged: they shipped, but late, over budget or with an unsatisfactory result.
- Agent Engineering changes the math in 2026 — by less than the decks claim. On greenfield work AI coding agents move the total build cost somewhere between a 4.5% saving and a 2.75% increase before the senior-leaning rate effect, because the feature hours they save come back as review and QA. The big gains sit in existing codebases: we measured ~30–40% team velocity on a platform with 200,000 lines of custom code.
Why Fora Soft wrote this playbook
Fora Soft is a software development company with 50 in-house engineers. Since 2005 we have shipped 250+ software products, from HIPAA telehealth like CirrusMED to edtech platforms like BrainCert, most of them real-time video, AI and audio platforms where one misjudged SDK choice can double a quote. Over two decades of scoping calls we have written, signed and delivered every shape of estimate there is: napkin pitches for founders, 40-page Master Service Agreements for Fortune-listed enterprises, sprint-by-sprint burndown plans, outcome-based engagements and everything between. This playbook compresses what actually holds up under a signed purchase order.
We run discovery before every fixed quote, we track our own estimate-vs-actual variance per project — ask and we will send you the estimate-versus-actual line for our last ten fixed-bid builds, outliers included, before you commit to anything — and we know which line items vendors routinely forget — because we used to forget them too. If you want a second opinion on a quote you already have, or a clean discovery to replace the number you don’t trust, see our planning & analytics service or how we price and run the QA line.
Got an estimate from another vendor you don’t quite trust?
Email us the PDF or book 30 minutes. Either way we mark the missing line items, challenge the assumptions and send a second opinion back inside 48 hours. Under NDA if you prefer. No commitment, no pitch deck.
What software estimation actually is (and isn’t)
Software estimation is the discipline of forecasting how much time, money and risk a software project carries — so a buyer can make decisions. That is the full definition. It is not a promise, not a deadline and not a commitment. Steve McConnell, in Software Estimation: Demystifying the Black Art (2006), draws the line cleanly: an estimate is a probabilistic range, a target is a business goal, and a commitment is a promise to hit a target. Vendors that collapse those three into one number are not doing estimation — they are quoting.
Three words get used interchangeably in board decks and they are not the same job. Estimation produces a range; budgeting commits money to it; cost control keeps the two in contact after work starts.
| Discipline | Question it answers | Who owns it | Output |
|---|---|---|---|
| Cost estimation | What is this likely to cost, and how wrong could that be? | Vendor, with your tech lead auditing | A range with a confidence band and named assumptions |
| Budgeting | How much are we willing to commit, and out of which pot? | CFO or founder | An approved envelope and a release schedule |
| Cost control | Are we tracking to the envelope, and what happens when we are not? | PM and finance, every sprint | CPI and SPI, re-forecasts, change orders |
A vendor who is good at the first and silent about the third will still surprise you in month four.
For a founder or CTO hiring a partner, the practical question is narrower: “What’s the cheapest thing I can do right now to move my estimate from a range I can’t bank on to a range I can?” That is the whole job of software cost estimation, and the rest of this guide answers it stage by stage.
Why software estimates still miss
Software estimates miss for four reasons, and every one of them sits upstream of the code: scope creep (work agreed after the number was agreed), poor requirements gathering (the estimate prices a brief nobody pressure-tested), missing non-functional work (security, accessibility, performance, DevOps) and anchoring: picking a number that matches the budget rather than the scope. Hiring better developers fixes none of them.
The industry numbers are bad, and harder to read than they look. The Standish Group’s CHAOS research puts roughly 31% of projects successful, about 50% challenged (they shipped, but late, over budget or with an unsatisfactory result) and about 19% failed — cancelled before completion, or delivered and never used, in its 2020 data. “Successful” there has meant on time, on budget and with a satisfactory result ever since Standish changed the definition in CHAOS 2015; it no longer means full scope delivered. The famous 189% average cost overrun is the original 1994 CHAOS figure, and it described challenged and cancelled projects, not all of them. It is routinely misquoted as an industry-wide average; Standish’s 2004 edition had overruns on unsuccessful projects down near 56%, and post-2015 editions stopped publishing an average at all, so treat 189% as a historical high-water mark rather than today’s number. One caveat we owe you, because most vendor guides skip it: CHAOS is contested. Eveleens and Verhoef showed in IEEE Software (2010) that the definitions make the headline percentages close to unreproducible, and Jørgensen and Moløkken-Østvold (2006) could not reproduce the 189% figure at all — they were left speculating that the sample was non-random rather than able to prove it. Read the split as an order of magnitude, not a measurement. What is current: CISQ’s 2022 report put the cost of poor software quality in the US at $2.41 trillion a year, alongside $1.52 trillion of accumulated technical debt.
The Cone of Uncertainty — your estimate has a legal range
The Cone of Uncertainty is the rule that an estimate’s possible error is set by how much has been decided, not by how long you have been talking: at initial concept a rigorous software cost estimate can land anywhere from 0.25× to 4× the final actual cost, a 16× spread that closes only as scope, architecture and acceptance criteria get signed. Barry Boehm published the curve in Software Engineering Economics (1981) and called it the funnel curve; Steve McConnell popularised it in Rapid Development (1996), first used the name Cone of Uncertainty in Software Project Survival Guide (1997) and tabulated the bands in Software Estimation: Demystifying the Black Art (2006). All of them say the same thing: estimate variability is a function of how much has been decided, not how much has been discussed. At “initial concept” — the first 30-minute call — McConnell’s table in Software Estimation: Demystifying the Black Art (2006) puts a rigorous software cost estimate anywhere from 0.25× to 4× the final actual cost. That is a 16× spread. (The milestone labels are McConnell’s; on Boehm’s original curve the same 16× band sits at the feasibility stage.) Pretending otherwise is malpractice.
Two numbers get confused here, so keep them apart. The cone describes how far an outcome can land from an estimate made at that stage: 0.25–4× at initial concept. An estimate class — rough order of magnitude, budgetary, definitive — describes the tolerance a vendor commits to once there is something written to estimate against: −25%/+75% for a ROM, and tighter from there. The cone is the physics of not knowing yet. The class is the promise. A vendor quoting a class band with nothing written down is borrowing the promise without doing the work.
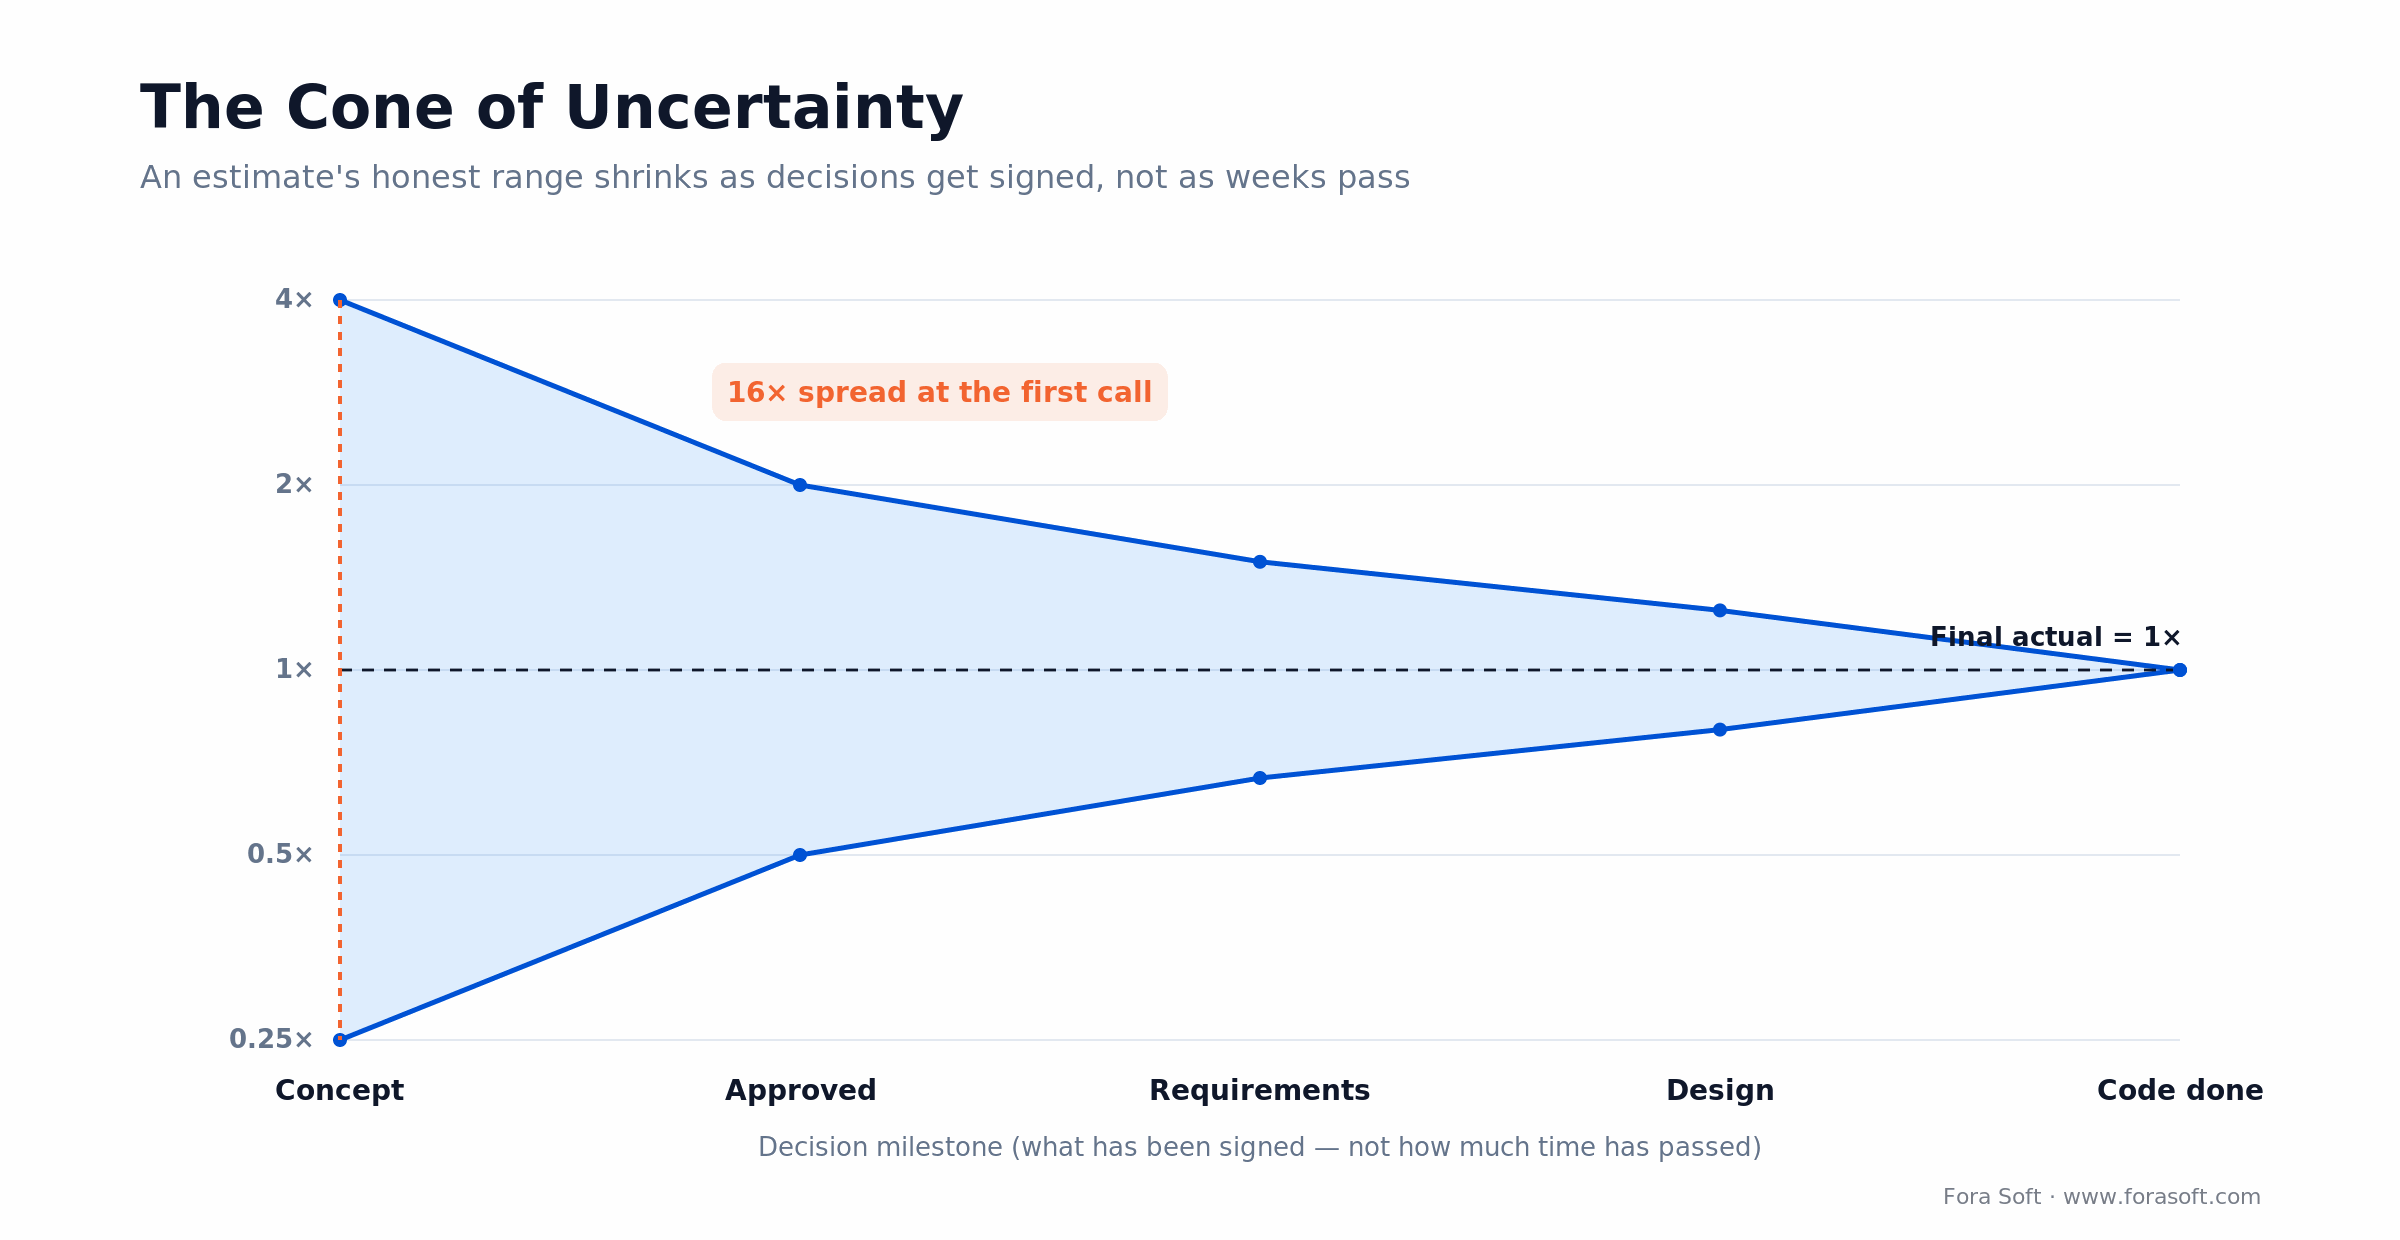
Figure 1. The Cone of Uncertainty. An estimate can land anywhere from 0.25× to 4× at concept, and only closes as decisions get signed.
Two groups misread this diagram in dangerous ways. Founders sometimes think the cone narrows with time — it does not. A team that has been “scoping” for four weeks with no written user story map, NFRs or acceptance criteria is still sitting in the 0.25–4× band. Vendors sometimes sell a fixed bid at the “pitch” stage and absorb the variance by padding 2–3×. Either the padding is right and the buyer overpays, or it is wrong and the project dies mid-build.
The cone has a serious dissenter and you should hear it from us rather than from the vendor you are negotiating against. Todd Little measured Landmark Graphics’ commercial project portfolio and reported in IEEE Software (2006) that the uncertainty range stayed roughly constant right through delivery — no narrowing. Our own read after twenty years: the cone closes when decisions get signed, and on projects where nobody signs anything it behaves exactly like Little’s data. Treat the cone as a model of decision-making, not a law of physics.
Reach for the cone when: a vendor quotes a single hard number for a 6-month build after one discovery call. Ask them which stage of the cone they think they’re at, and why.
Four estimate types, matched to the decision you’re making
Four classes cover every decision a buyer makes: a rough order of magnitude (−25%/+75%, 30–90 minutes) to decide whether the idea deserves a discovery, a budgetary estimate (−10%/+25%, 1–2 weeks) for board approval, a definitive estimate (−5%/+10%, 2–4 weeks of paid discovery) for a fixed-bid contract, and sprint-level forecasting (±10% per sprint) once a team has velocity. Not every estimate needs the same rigour: spending four weeks on a high-fidelity estimate for a decision worth $30k is a waste. Those bands, from −25%/+75% for a rough order of magnitude through −5%/+10% for a definitive estimate, come from the PMI cost-estimating tradition, and AACE International publishes the equivalent Class 5 to Class 1 scheme in Recommended Practice 17R-97. We map them to buyer decisions below.
| Type | Accuracy | Effort to produce | Use it for | Don’t use it for |
|---|---|---|---|---|
| Rough order of magnitude (ROM) | −25% to +75% | 30–90 min | Deciding whether the idea is worth a proper discovery at all | Signing a fixed-bid contract |
| Budgetary | −10% to +25% | 1–2 weeks | Board approval, CFO budget line, go/no-go | Committing to a calendar launch date |
| Definitive | −5% to +10% | 2–4 weeks of paid discovery | Fixed-bid contract, launch-date commitment | Validating whether to build at all |
| Sprint-level | ±10% per sprint (after 3–4 sprints) | 2–4 hours per sprint | Sprint capacity planning, next-release forecast | Long-horizon commercial commitments |
Most founders we meet are asking for a definitive estimate at a stage that only supports a budgetary one. The fix is not more meetings; it is a paid discovery that compresses the cone enough to earn the extra precision.
Reach for a definitive estimate when: you are about to sign a fixed-bid contract or commit to a launch date, and only after a paid discovery has locked the scope to −5%/+10%.
Six estimation methods a serious vendor still uses
Six methods survive contact with real projects: analogous estimation from past actuals, top-down decomposition into epics, bottom-up work-breakdown structure, parametric models (COCOMO II, Function Points), Planning Poker, and three-point PERT with Monte Carlo. Below is what each one is good for, with the scars to explain why. Treat them as a toolkit, not a menu — stack at least two per estimate and compare.
Analogous (expert judgement from past projects)
Pull up a finished project that looks architecturally similar, take its actuals, adjust for size, tech stack and team skill, publish the result. Cheap, fast, honest about its own assumptions, surprisingly accurate when historical data exists. Fails when the new project has a truly novel component (first LLM integration, first FDA device) with no analogue in your history. Works well at the pitch / concept stage.
Top-down (decompose from project to epics)
Break the project into 6–10 epics, assign a range to each from analogous history, sum. Great for the CFO view. Poor for sprint-level planning because it hides the 300-story detail that drives actual burn. Good first pass during discovery to sanity-check the bottom-up.
Bottom-up / Work Breakdown Structure
Decompose down to tasks of 4–16 engineer-hours, estimate each, sum with PM/QA/DevOps overhead. Most accurate once you have a complete user story map, acceptance criteria and architecture. Expensive to produce — we charge for this during discovery — and catastrophically wrong if fed incomplete scope. This is what a definitive estimate is built on.
Parametric (COCOMO II, Function Points)
Feed a model (size in KLOC or function points, complexity factors, team experience) and get a mathematical output. Useful as a tie-breaker when top-down and bottom-up disagree. Caveat worth getting right: COCOMO II (introduced 1995, recalibrated on 161 projects for the COCOMO II.2000 release) was built for iterative, spiral and reuse-heavy development; it is COCOMO 81 that was fitted to 63 sequential TRW projects from the 1960s and 1970s and published in 1981. The problem is the data behind the coefficients, which is 1990s work: run uncalibrated against a modern cloud, microservice or AI-assisted stack and the output drifts far enough to be useless as a primary number. If a vendor cites COCOMO, ask when they last recalibrated against their own actuals.
What a parametric run actually looks like, since most guides assert it and never show it. Count the function points of a small booking module — say 6 external inputs, 4 external outputs, 3 external inquiries, 5 internal logical files and 2 external interface files at average complexity. IFPUG average weights give 6×4 + 4×5 + 3×4 + 5×10 + 2×7 = 24 + 20 + 12 + 50 + 14 = 120 unadjusted function points. COCOMO II’s post-architecture form is Effort = A × Size^E × ∏EM, with A = 2.94 and Size in thousands of lines; at the QSM backfiring table’s average of ~53 Java lines per function point that is 6.4 KSLOC, and with a nominal exponent E = 1.0997 and effort multipliers at 1.0 you get 2.94 × 6.4^1.0997 ≈ 23 person-months. Now sanity-check it: 23 person-months for one booking module is obviously high for a 2026 cloud stack, because the coefficients were fitted on 1990s projects with 1990s reuse. That gap is the whole argument for calibrating the model against your own actuals before you quote from it — or for keeping it, as we do, strictly as a tie-breaker.
Planning Poker (consensus story points)
James Grenning invented it in 2002 as a faster Wideband Delphi; Mike Cohn popularised it in Agile Estimating and Planning (2005); the Planning Poker mark is registered to his company, Mountain Goat Software. The whole engineering team plays modified Fibonacci cards (1, 2, 3, 5, 8, 13, 20, 40, 100) for each story; outliers explain, the team re-votes, consensus lands. Catches hidden complexity that one-person estimates always miss, and builds team ownership of the plan. After 3–4 sprints velocity stabilises and points-per-sprint becomes a usable forecast. Forecast the remaining backlog in sprints, not in hours. Story points are deliberately unitless, and Cohn is explicit that converting them back to hours throws away the reason they work. Do not use it at the pitch stage — you don’t have a team yet.
3-Point PERT + Monte Carlo
For every bottom-up line, capture three numbers: Optimistic (O), Most Likely (M), Pessimistic (P). Expected duration is (O + 4M + P) / 6; standard deviation (P − O) / 6. Gives you honest confidence bands rather than false-precision point numbers. Monte Carlo runs 10,000+ simulated schedules over those distributions and produces a curve — for example, “50% chance to finish by 14 weeks, 90% chance by 18 weeks.” That curve is how you negotiate the launch-date clause.
Two assumptions ride along, and vendors rarely name them. (P − O) / 6 assumes your optimistic-to-pessimistic spread covers about six standard deviations, so a timid P understates the risk. And rolling individual task variances up into one project band assumes the tasks are independent — in software they almost never are, which is why a naive Monte Carlo run understates the bad tail. Where several lines share one dependency (a payment provider, an SDK, one senior engineer), widen the pessimistic leg by hand before you sum.
Here is the whole method on six lines, so you can run it on your own quote tonight. Take a video-consultation MVP, estimates in engineer-weeks:
| WBS line | O | M | P | Expected (O+4M+P)/6 | SD (P−O)/6 |
|---|---|---|---|---|---|
| Auth, roles, onboarding | 2.0 | 3.0 | 5.0 | 3.17 | 0.50 |
| WebRTC call + recording | 5.0 | 8.0 | 16.0 | 8.83 | 1.83 |
| Scheduling + notifications | 2.0 | 3.5 | 6.0 | 3.67 | 0.67 |
| EHR / FHIR integration | 3.0 | 6.0 | 14.0 | 6.83 | 1.83 |
| Payments + billing | 2.0 | 3.0 | 7.0 | 3.50 | 0.83 |
| Admin console + reporting | 2.0 | 4.0 | 7.0 | 4.17 | 0.83 |
To turn a 3-point PERT estimate into a P80: take each line’s expected value as (O + 4M + P) / 6 and its standard deviation as (P − O) / 6, sum the expected values, sum the variances rather than the deviations, take the square root of that sum, and add 0.84 standard deviations to the mean. Run on the table above, the expected column sums to 30.2 engineer-weeks and the variances sum as: 0.50² + 1.83² + 0.67² + 1.83² + 0.83² + 0.83² = 8.77, and the square root of 8.77 is 2.96. P80 sits 0.84 standard deviations above the mean, so P50 = 30.2 weeks and P80 = 30.2 + (0.84 × 2.96) = 32.7 weeks of engineering effort. That is the sentence a board can sign: “30 engineer-weeks at 50% confidence, 33 at 80%” — not “30 weeks”. Notice how small the spread looks: two of those six lines share one integration risk, so in practice we widen the WebRTC and FHIR pessimistic legs before summing, which pushes P80 nearer 35.
Other techniques you will hear named
Four more come up in RFPs and academic reading, and you should know what they are even though we do not lead with them. Expert judgement is analogous estimation without the historical data — a senior engineer’s read; fast, and only as good as the engineer’s scars. Wideband Delphi is the anonymous, multi-round ancestor of Planning Poker: experts estimate privately, see the spread, discuss the outliers and re-estimate. Use Case Points sizes a system from its use cases and actors instead of its functions; it needs a well-formed use-case model, which most 2026 product teams do not keep. SEER-SEM is a commercial parametric model in the Jensen/Putnam lineage rather than the COCOMO one, common in defence and aerospace where a calibrated database exists. On sizing units: LOC (lines of code) is cheap to measure and language-dependent, so it is nearly useless for cross-stack comparison; function points measure delivered functionality and survive a language change, which is why the parametric models prefer them. We price from a bottom-up WBS because on commercial product work it beats all of these, and we say so rather than listing them for completeness.
Reach for bottom-up plus 3-point PERT when: you need a number you will defend to a board. It is the cheapest pairing that yields a P50/P80 confidence band instead of a false-precision single figure; Monte Carlo over the same three-point inputs gives you the full curve when a board wants one.
Which method fits which stage — a fit matrix
Analogous and top-down estimation fit the pitch; bottom-up WBS with 3-point PERT fits discovery, the definitive estimate and in-flight change orders; Planning Poker fits sprint-level forecasting once a team has velocity; parametric models are a cross-check at best. The matrix and table below map all six methods to all five decision stages. Stack at least two per estimate — if they disagree by more than 1.5×, your scope is not locked enough yet.
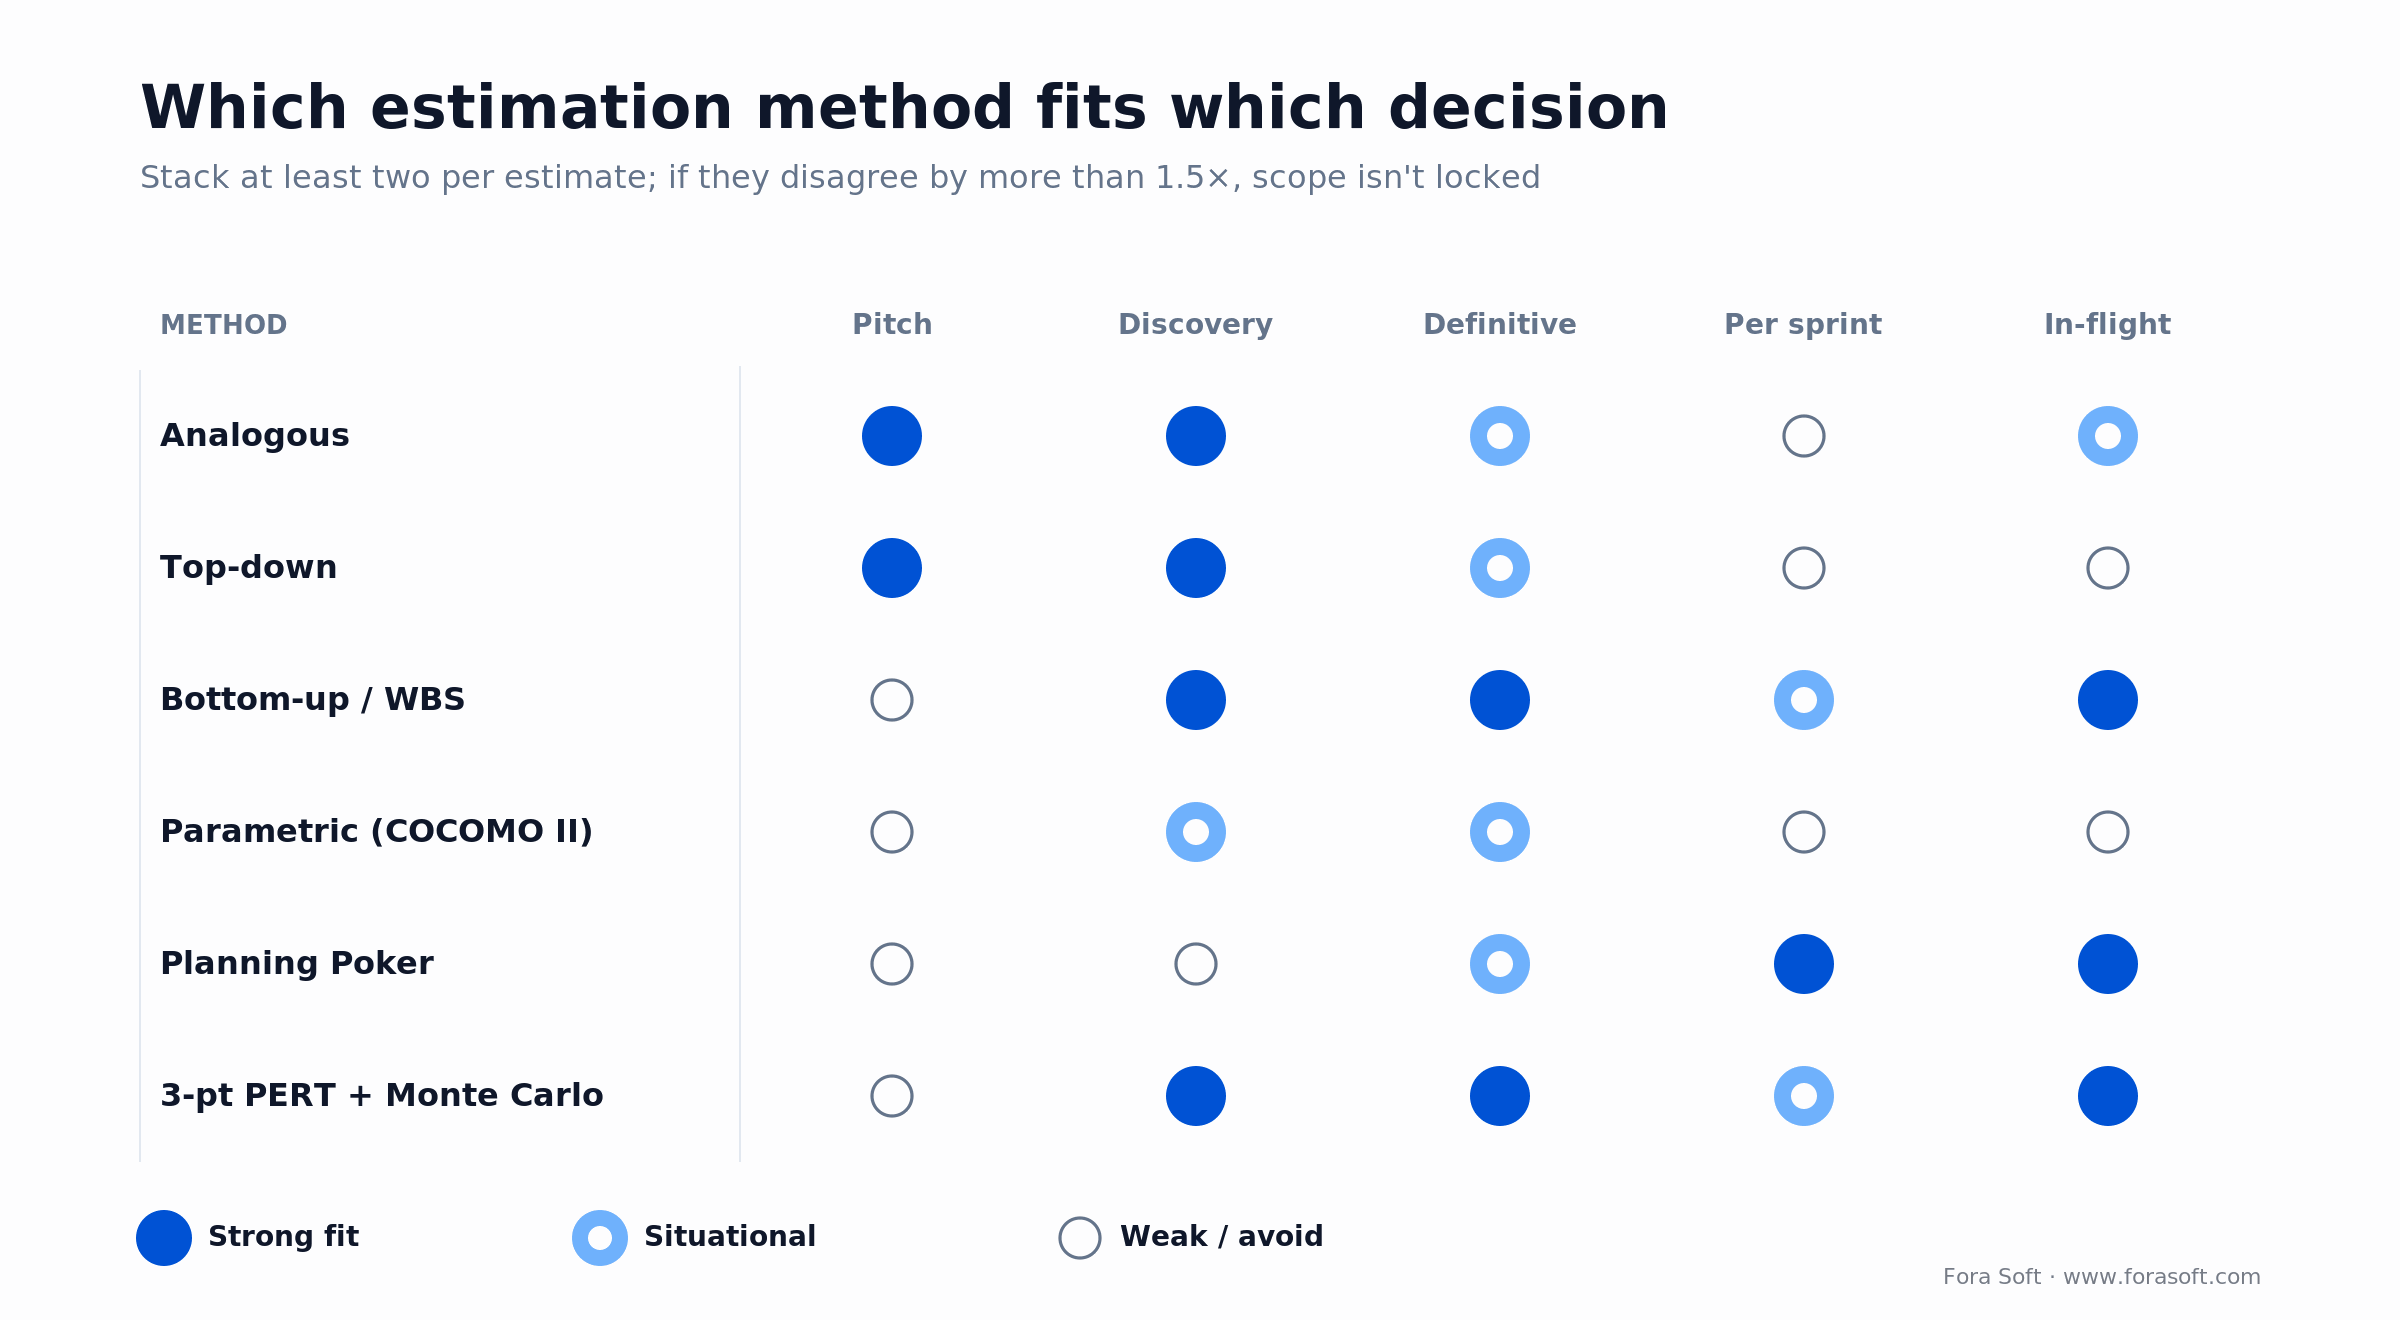
Figure 2. Which estimation method fits which decision stage. Stack at least two; if they disagree by more than 1.5×, scope isn’t locked yet.
| Method | Pitch | Discovery | Definitive | Per sprint | In-flight change |
|---|---|---|---|---|---|
| Analogous | Strong | Strong | Situational | Weak | Situational |
| Top-down | Strong | Strong | Situational | Weak | Weak |
| Bottom-up / WBS | Weak | Strong | Strong | Situational | Strong |
| Parametric (COCOMO II, Function Points) | Weak | Situational | Situational | Weak | Weak |
| Planning Poker | Weak | Weak | Situational | Strong | Strong |
| 3-point PERT + Monte Carlo | Weak | Strong | Strong | Situational | Strong |
How discovery compresses the estimate, stage by stage
A paid discovery compresses the estimate in four steps: a 30-minute call and a one-paragraph brief buy a ROM at −25%/+75%, a full written product brief buys a budgetary number at −10%/+25%, a user-story map plus NFRs takes it to about −10%/+20%, and an architecture, risk register and bottom-up 3-point estimate land the definitive number at −5%/+10%. The pattern behind most overruns is the opposite: signing a fixed bid at step one and discovering the scope at step four.
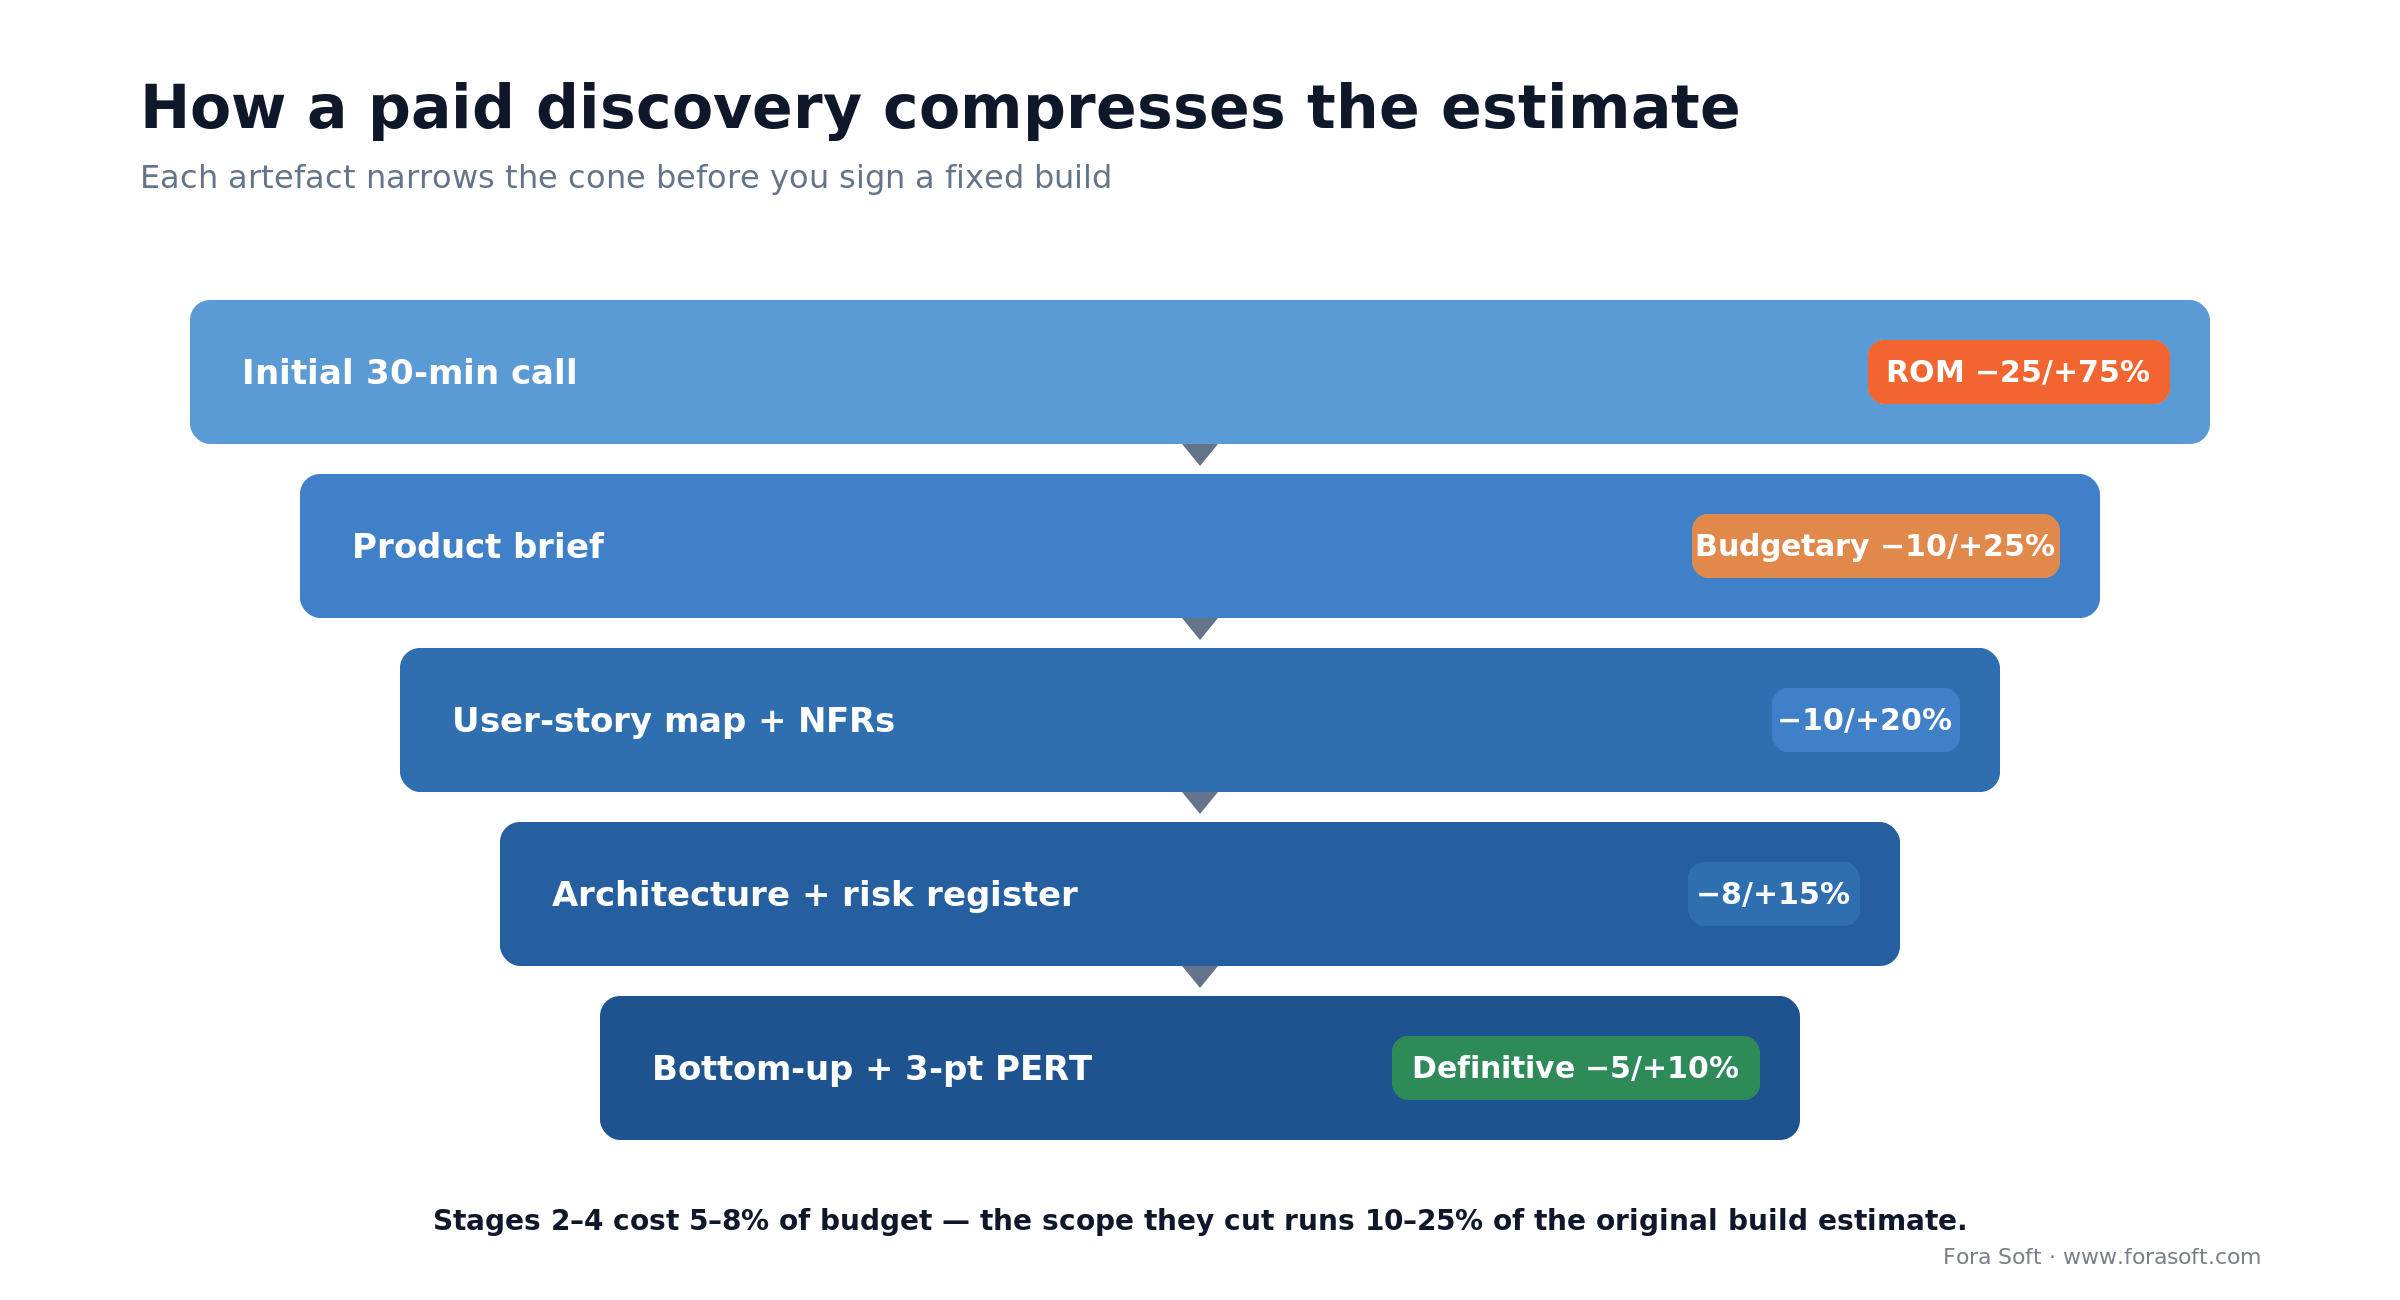
Figure 3. A paid discovery compresses the estimate from a −25%/+75% ROM to a definitive −5%/+10% band. Each artefact buys a tighter number before you sign.
Stages 2 through 4 typically cost 5–8% of total budget. On our own projects the scope we cut or re-sequence during discovery has run 10–25% of the original build estimate, which is why a discovery usually pays for itself before the first sprint rather than after it. Not always in that direction, though: sometimes discovery finds work the quote had missed and the number goes up, as in the mini case below. That is still money saved — you pay it before you sign instead of in month four. See why launching lean beats a full-scope push for how we usually scope stage 2.
What a complete estimate must price (and what most quotes miss)
A complete software estimate prices ten line items: feature engineering (35–45% of the build), edge cases and error handling (10–15%), QA (15–25%), UI/UX iteration (8–12%), DevOps and CI/CD (5–10%), security and compliance (5–15%), accessibility (3–6%) and performance testing (2–5%), plus PM and architecture oversight (+10–15%) and a risk buffer (+10–20%) quoted on top of that build. The percentages are typical ranges per line, not a partition that has to add to 100. Most under-quotes happen because the functional feature lines are right and the ones around them are simply absent, so ask any vendor to show all ten explicitly.
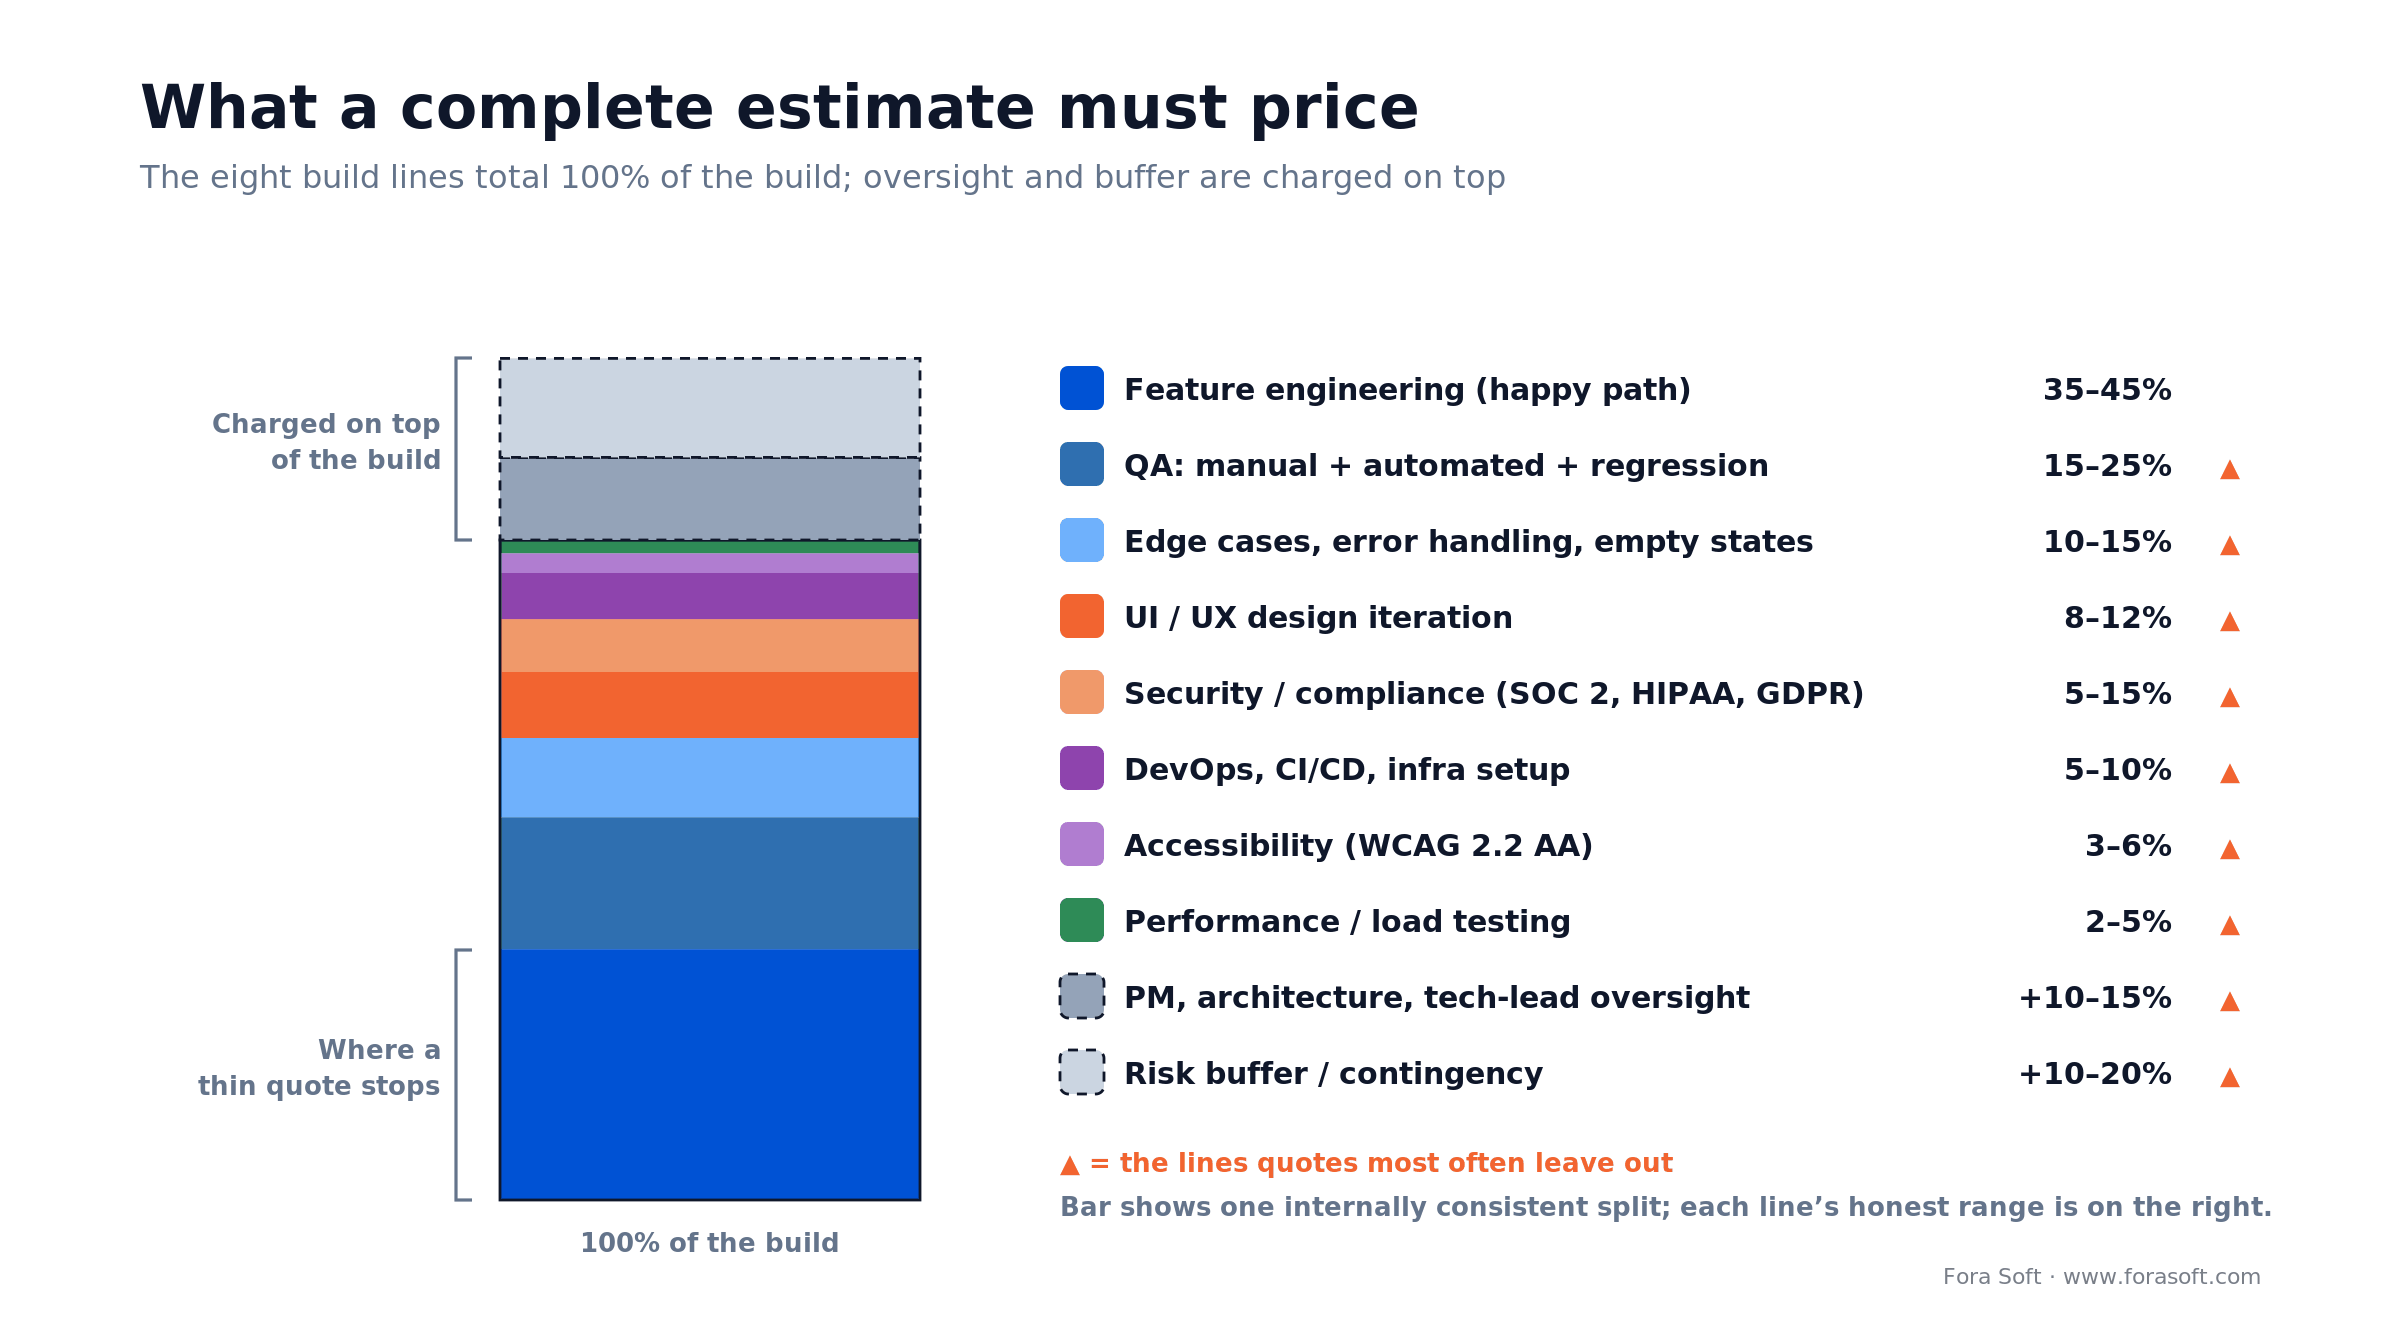
Figure 4. What a complete estimate prices. The eight build lines total 100% of the build; PM oversight and the risk buffer are charged on top.
| Line item | Typical share of build | Often missing |
|---|---|---|
| Feature engineering (happy path) | 35–45% | — |
| Edge cases, error handling, empty states | 10–15% | Almost always |
| QA (manual + automated + regression) | 15–25% | Often undersized |
| UI / UX design iteration | 8–12% | Quoted only for v1 screens |
| DevOps, CI/CD, infra setup | 5–10% | Often |
| Security / compliance (SOC 2, HIPAA, GDPR) | 5–15% | Almost always |
| Accessibility (WCAG 2.2 AA) | 3–6% | Usually |
| Performance / load testing | 2–5% | Usually |
| PM, architecture, tech lead oversight | +10–15% on top | Hidden inside “team” |
| Risk buffer / contingency | +10–20% on top | Often disguised as “buffer” |
If an estimate adds up to roughly the sum of feature engineering hours only, the vendor has quoted 35–45% of the build — and because oversight and buffer are charged on top, that is only about 26–38% of the real cost (35–45% of the build, divided by the 1.20–1.35 that oversight and buffer add on top). They are either planning to absorb the rest or — more commonly — to recover it through change orders later.
Contract models: who owns the risk when the estimate is wrong
Five contract shapes show up in our MSAs in 2026: fixed price, time and materials, capped time and materials, a paid discovery on capped T&M followed by a fixed-bid build (our default for greenfield products), and outcome-based engagements. Each one parks the risk of a wrong estimate somewhere different, which is the only reason the choice matters.
| Model | Best for | Price predictability | Flexibility | Who carries estimate risk |
|---|---|---|---|---|
| Fixed-bid | Tight, proven scope after discovery | High | Low | Vendor (paid for via padding) |
| Time & materials (T&M) | Exploratory, research, fast-changing scope | Low | High | Buyer |
| Capped T&M | Discovery phases, prototype sprints | Medium | High | Shared |
| Discovery T&M + build fixed | Greenfield product — our default | Medium then High | High then Medium | Shared |
| Outcome-based | Measurable KPIs, strong baseline | Variable | Medium | Shared (vendor has upside) |
Reach for “discovery T&M then build fixed” when: you are a founder building a new product from zero. It is the only shape that lets the estimate earn its accuracy before you sign for it.
For a parallel perspective on hiring mechanics see how we structure and staff a development team.
Want a paid discovery that lands a definitive estimate?
Two- to four-week sprint on capped time and materials, ceiling agreed before we start; deliverable is a signed user-story map, architecture, risk register and a −5%/+10% build quote you can take to the board.
Agent Engineering in 2026 — what it actually changes in your estimate
AI coding agents change a 2026 software cost estimate far less than the decks promise: on a greenfield build the honest net effect on the build cost runs from a 4.5% saving to a 2.75% increase, because the hours the agents take out of feature work come back as review and QA — and once the senior-leaning staff mix lifts the blended rate, the invoice is closer to a wash than a discount. Where they genuinely pay is existing code. On VALT, a 12-year-old platform with about 200,000 lines of custom code, we measured a ~30–40% team velocity gain, and almost all of it came from orientation rather than typing. The adoption is real: Stack Overflow’s 2025 developer survey found 84% of developers using or planning to use AI tools and 51% of professional developers using them daily, and JetBrains’ 2025 State of Developer Ecosystem puts regular AI use at 85%.
The catch is downstream. GitClear’s analysis of 211 million lines tracked code churn rising from 3.3% in 2021, before assistants were common, to 5.7% in 2024, with duplicated code blocks climbing much faster; its 2026 follow-up on 623 million changes puts two-week churn about 15% above the 2023 level and duplicated blocks up 81%. Google’s 2024 DORA report priced the trade: every 25% increase in AI adoption was associated with a 7.2% drop in delivery stability and a 1.5% drop in throughput, with shrinking batch discipline the suspected cause. The 2025 DORA edition reverses the throughput half: AI adoption now tracks with higher throughput, while the instability stays. Translated to an estimate, that means:
- Feature engineering shrinks 10–20% on familiar work and 10–15% on greenfield, not 40%. Boilerplate, CRUD, API glue, migrations and test scaffolding get the biggest cut. Pure greenfield typing on a clean canvas moved only ~10–15% in our own measurements, which is the figure we use for a greenfield estimate below, and bespoke video and AI pipelines, domain-specific ML, SDK integrations and hardware-adjacent work barely move at all.
- QA and code review grow ~15–25%. More code per hour means more review per hour. Cutting the review line is the fastest way to turn that churn into production incidents.
- Staff mix leans senior, and that costs money. In our own pods the senior-lead / mid / junior mix that made commercial sense in 2022 (roughly 1:2:2) now sits nearer 1:2:1, with one or two senior reviewers per pod. That is our staffing, not an industry benchmark, and it lifts the blended hourly rate by high single digits, which eats into whatever the agents saved.
- Net effect on a typical 12-week greenfield build: run the arithmetic, not the slogan. Feature engineering is 35–45% of the build and QA 15–25% (the same line items as above). Use our measured greenfield figure, 10–15%, not the top of the boilerplate band, and add 15–25% to QA: best case 45 × −15% = −6.75 points against 15 × +15% = +2.25 points, so −4.5%; worst case 35 × −10% = −3.50 points against 25 × +25% = +6.25 points, so +2.75%. The honest band is a 4.5% saving to a 2.75% increase, before the senior-leaning rate effect. Any vendor quoting a flat “AI makes it 50% cheaper” on greenfield without adjusting review lines is inflating their margin.
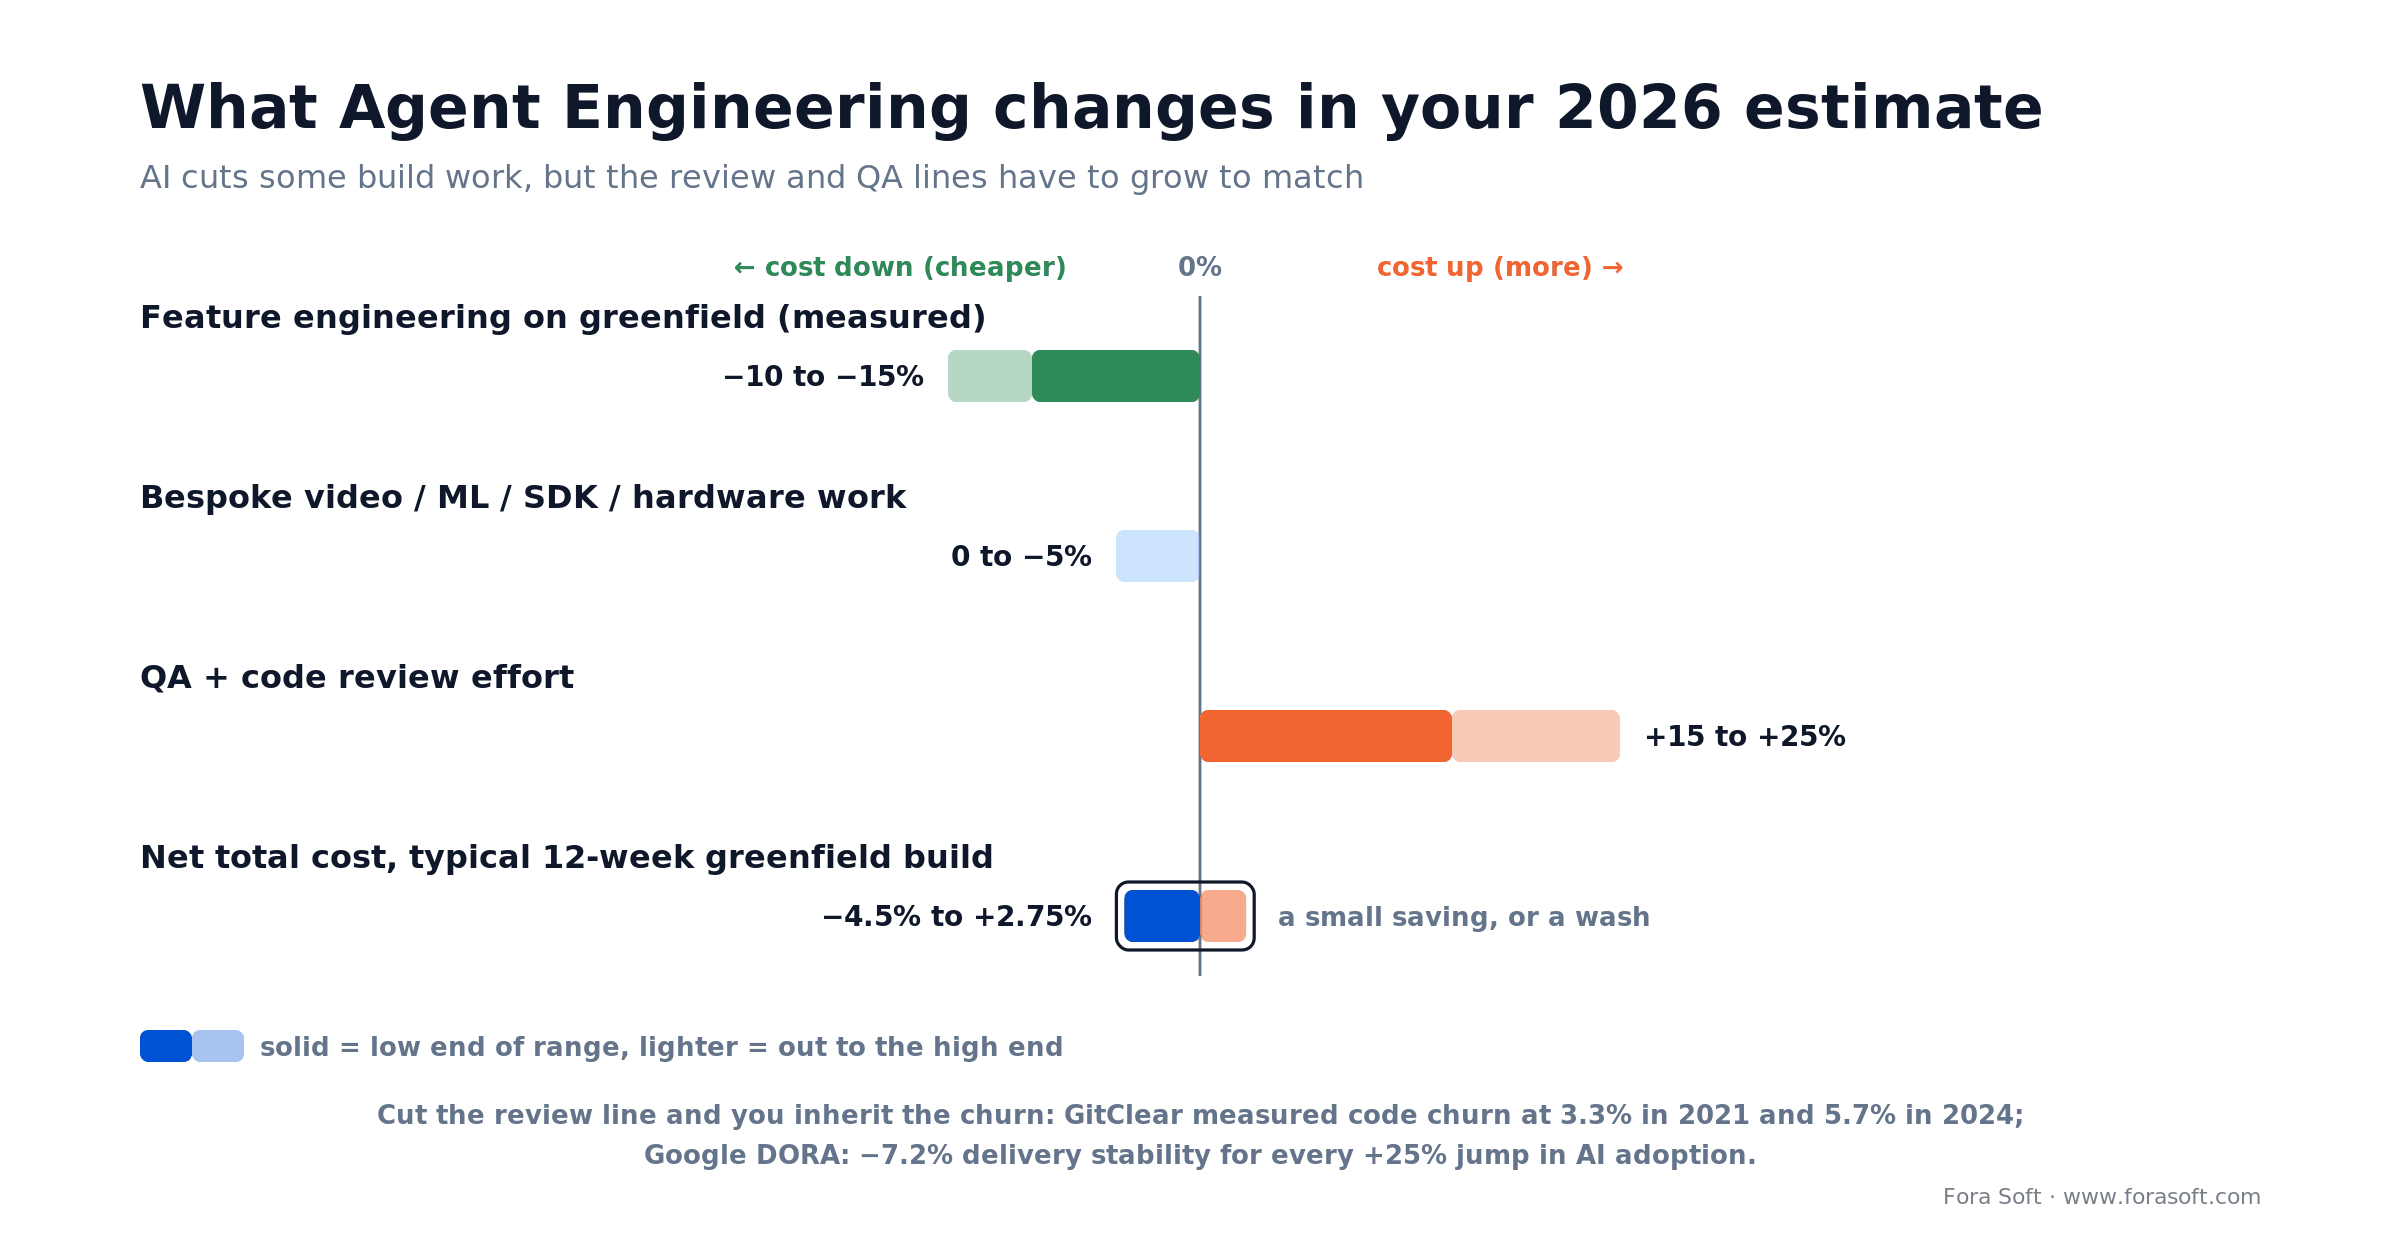
Figure 5. How Agent Engineering shifts a 2026 greenfield estimate: feature work down 10–15%, QA and review up 15–25%, net total cost between −4.5% and +2.75%.
For a real delivery case with numbers attached, see the ~30–40% team velocity gain we measured on VALT, a 12-year-old, 200K-line video platform. Note what that number is and isn’t: it is velocity on a mature codebase, where the gain came from orientation (finding the right file, reading unfamiliar code, reconstructing intent) rather than typing. That is why the two numbers in this section point in different directions and both are ours: ~30–40% where an agent reads a large existing codebase for you, ~10–15% where an engineer types new code on a clean canvas. If a vendor quotes you one number for both, ask which kind of work they measured. And to be precise about our own claim in that case study, that our budgets land 20–30% under incumbent agencies on comparable scope: that gap comes from the whole delivery model (small senior pods, no layered account management, discovery before commitment), not from the AI line alone. The AI line is worth a few points, not thirty.
Mini case — how a discovery rescued a $420k mis-estimate
Situation. A US-based edtech founder came to us with a fixed-bid quote from another vendor: $420k for a tutoring platform with live video, shared whiteboard, AI lesson-plan generation and LTI integration with a dozen LMS products. The quote was 26 pages of feature bullets, no NFRs, no WBS, no risk register. Build was planned for 14 weeks.
The discovery. We ran a 3-week paid discovery (~$30k). Deliverables: user-story map (147 stories), risk register with 31 entries, reference architecture, NFR brief including FERPA and SOC 2 implications, and a bottom-up + 3-point PERT estimate with Monte Carlo schedule. Two decisions the original quote had not priced: (a) LTI integrations needed to cover 12 LMS variants rather than one, and (b) the AI lesson-plan feature required a human-in-the-loop review flow for FERPA-covered districts.
Outcome. True scope at −5%/+10% landed at $540k / 18 weeks — 29% higher than the original quote and 29% longer (420 → 540 and 14 → 18 are the same 1.29×). The founder went back to the first vendor, who eventually conceded they would have change-ordered the delta at month 3 or 4. The client signed our fixed build, shipped on the 18-week plan without a single change order, and avoided the mid-project renegotiation that kills most edtech rounds. Both numbers sit outside the typical edtech band in the cost table below: higher because twelve LTI variants bought scope, shorter because the scope was fully locked before the first sprint. All-in that is $570k (the $540k build plus the $30k discovery) against the $420k originally quoted, and we would rather you see that number than have us quietly leave it out. This is the case where discovery did not cut scope; it exposed 29% the first vendor had not priced. The client is under NDA; the figures come from our own project records. See the ALDA AI course-generator build for a comparable edtech case with 500k+ students.
A directional cost model — typical ranges we see in 2026
MVP budgets in our 2026 pipeline run roughly $35k–$90k for an internal tool or B2B dashboard, $60k–$140k for a single-platform consumer mobile app, $90k–$220k for a subscription SaaS, $90k–$260k for an AI-assisted product, $130k–$320k for real-time video or telehealth, and $180k–$480k for an edtech platform with live sessions. These are ranges we have seen in our own pipeline, not industry benchmarks. Treat them as an analogous-estimation reference, not a quote. Anyone quoting a point number without discovery is guessing.
| Product shape | MVP range (USD) | Timeline | Key risk driver |
|---|---|---|---|
| Internal tool / B2B dashboard | $35k–$90k | 6–12 wk | Integrations with legacy systems |
| Consumer mobile (1 platform) | $60k–$140k | 8–16 wk | Design iteration, store review |
| SaaS with subscription + admin | $90k–$220k | 12–24 wk | Payments, roles, multi-tenancy |
| Real-time video / telehealth | $130k–$320k | 16–28 wk | SFU / transport, compliance |
| AI-assisted product (LLM + RAG) | $90k–$260k | 10–20 wk | Eval pipeline, inference cost |
| Edtech platform with live sessions | $180k–$480k | 20–32 wk | FERPA, LMS integrations, video |
For deeper breakdowns see our mobile app development cost guide and the video-streaming CTO pricing guide. We use Hetzner AX-series and DigitalOcean for most self-hosted workloads and keep cloud-egress assumptions explicit in every quote.
What the build number leaves out: run costs and team model
Every range above stops at launch. Two costs sit outside it and both belong in the same board conversation.
Run costs. We budget 15–25% of the build cost per year to keep a shipped product alive: hosting and egress, third-party API and SDK fees, monitoring, dependency and OS upgrades, security patching, app-store compliance, and the steady trickle of defect and UX work every live product generates. On a $200k build that is $30k–$50k a year before anyone writes a new feature. A quote that does not name this line is not wrong, but it is incomplete. Ask for it in writing before you compare vendors on price.
In-house or a contract team. Compare fully loaded, not salary to rate. A US senior engineer on a $180k salary (the mid-market 2026 range we see in our own hiring, not big-tech) costs roughly $225k–$250k once benefits, payroll taxes, equipment, software licences and amortised recruiting are in. Spread over the 1,700–1,800 delivery hours that survive holidays, PTO and ramp out of 2,080 gross, that is about $125–$147 per productive hour, and it keeps running between projects. A contract pod bills a rate with all of that already inside it, brings the QA, PM and DevOps you would otherwise hire separately, and stops when the build stops. In-house wins when the product is your core IP and the roadmap runs for years. A contract team wins when the roadmap is one build long, the stack is unfamiliar, or hiring would take longer than the build itself.
A decision framework — accept an estimate in five questions
Before you counter-sign any quote, ask the vendor five questions: which stage of the Cone of Uncertainty the number came from, what the top five assumptions are and what each is worth in hours, what is explicitly out of scope, what the confidence band is (P50 and P80), and how change orders and sprint velocity will be tracked. If a vendor can’t answer all five in writing in under a day, the estimate is not yet worth your signature.
- Which stage of the Cone of Uncertainty are you quoting from? Expected answer: an explicit stage (“requirements complete, 0.67–1.5×”) and the artefacts that got you there (WBS, user-story map, architecture).
- What are the top five assumptions, and what happens to the number if each one flips? Expected answer: a list with ±hours per assumption. No assumptions = no estimate.
- What is explicitly not in scope? Expected answer: a short exclusion list. “Nothing is excluded” is a red flag.
- What is the confidence band — 50%, 80%, 90%? Expected answer: a P50 / P80 pair from PERT or Monte Carlo. If there is only one number, it is P50 with the uncertainty rolled in invisibly.
- What is the change-order process, and how is velocity tracked? Expected answer: a written change-order SLA, a sprint-level velocity plan, and a standing weekly rhythm for re-forecast. Silent velocity tracking is how over-runs get discovered in month 4.
Pitfalls — five ways estimation quietly destroys projects
Five estimation mistakes kill more software projects than bad code: anchoring the scope to a stated budget, padding without naming the reserve, leaving non-functional work unpriced, assuming an integration is as easy as its SDK docs claim, and estimating once without re-forecasting each sprint. Every one of them is visible in the paperwork before the first sprint starts.
- Anchoring to the budget. A founder says “we have $120k.” The vendor reverse-engineers a scope that totals $120k. The project ships at $190k. The mistake is conversational: stop stating a number before the scope is discovered. State a decision instead (“we can commit $120k to an MVP, $200k total over 18 months”) and ask the vendor to fit scope to that envelope.
- Padding without naming it. Hidden contingency (“I’ll just double everything”) is unfalsifiable. If the project ships early, the padding becomes vendor profit. If it overruns, there’s no residual to draw on. Always ask for explicit reserve line items.
- Ignoring non-functional requirements. Authentication hardening, logging, monitoring, accessibility, security review, GDPR / HIPAA posture, load testing, observability, CI/CD — none of these appear in a feature list, all of them cost weeks. They deserve named line items.
- Optimism bias on integrations. “There’s an SDK for that” is almost never the whole story. Payment providers, SSO vendors, LMS systems, IoT gateways and SIP stacks have each cost us 3–5 weeks beyond what the SDK docs show. That range is our own delivery history, not an industry figure. See what not to do when cutting costs for more on this.
- Estimating once, never re-forecasting. An estimate is a hypothesis. After sprint 2 you have data. If the vendor does not publish an updated forecast against actuals every sprint, the cone never closes. In our experience silent estimate drift is the earliest visible sign that a project is heading for cancellation, long before the budget line shows it.
KPIs — how to measure estimation health
Three numbers tell you whether a vendor’s estimates can be trusted: the Estimate-Accuracy-Ratio (actual divided by estimate) should sit between 0.9 and 1.1 from sprint three onward, the Cost Performance Index at 0.95 or above, and the Schedule Performance Index at 0.90 or above. Ask for all three by name, every sprint, in writing.
Quality KPIs. Estimate-Accuracy-Ratio (actual / estimate) per sprint. Target: 0.9–1.1 after sprint 3. Anything outside 0.7–1.3 for two sprints in a row is a scope-creep or under-estimation alarm.
Business KPIs. Cost Performance Index (earned value / actual cost). Target: ≥ 0.95. Schedule Performance Index (earned value / planned value; note it drifts toward 1.0 as a project completes, however late it is, which is why Earned Schedule exists — read it mid-project, not at the end). Target: ≥ 0.90. These two numbers together tell you whether you are burning budget, burning calendar, or both.
Reliability KPIs. Forecast-variance trend. Plot sprint-level estimate-vs-actual as a line; a flat line means the vendor’s estimates are trustworthy, a widening cone means they are not. Change-order frequency — more than one material change order per four sprints usually means the discovery was skipped, not that requirements changed.
AI in the estimation process itself
LLMs are now genuinely useful during discovery: generating first-draft user story maps from a product brief, converting rough Figma screens into acceptance criteria, flagging likely NFR gaps, and spotting inconsistencies between a requirements doc and a wireframe in minutes rather than days. We use them routinely at Fora Soft, always with human review, and on our own discoveries they have taken roughly a third off stages 2 and 3. That is our number, measured on our projects; treat it as a claim to test, not a benchmark.
What they cannot do yet: replace the judgement call on whether a given scope is a 3-week or a 9-week piece of work. That judgement is still analogous estimation by a senior engineer with domain scars. For how we run AI inside our pipeline see AI in the software development process and AI in software architecture design.
When to not run a heavy estimation
Skip the heavy estimation when the project runs under ~8 weeks or under ~$40k and buy a capped sprint instead; above that threshold the math of a discovery pays for itself every time. If you are buying a two-week prototype to test a hypothesis, the right answer is a capped T&M engagement with a written kill-switch — not a 3-week discovery and bottom-up WBS. If the work is maintenance on a mature product with a stable team, velocity history is more accurate than any re-estimation exercise.
Estimating your first video, AI or edtech build?
That’s what we’ve done since 2005 — 250+ shipped products, 20+ years of real-time and AI scars. Tell us the one-sentence version and we’ll come back with a ROM at −25%/+75% and a written list of the decisions that would narrow it.
FAQ
What is software cost estimation?
Software cost estimation is the practice of forecasting how much money, time and risk a software project will take, and expressing the answer as a range with a stated confidence rather than a single number. It is not budgeting (committing the money) and not cost control (tracking against the commitment). A credible estimate names its stage on the Cone of Uncertainty, lists its assumptions and exclusions, and comes with a confidence band such as a P50 and P80 pair.
What should a software development estimate include?
A software development estimate should price ten line items, not just the features: feature engineering (35–45% of the build), edge cases and error handling (10–15%), QA (15–25%), UI/UX iteration (8–12%), DevOps and CI/CD (5–10%), security and compliance (5–15%), accessibility (3–6%) and performance testing (2–5%), plus PM and architecture oversight (+10–15%) and a risk buffer (+10–20%) quoted on top of the build. It should also carry written assumptions, an exclusions list, a confidence band and a change-order process. Quotes that price only the feature lines cover 35–45% of the build, which works out at roughly 26–38% of the real cost once oversight and buffer are added on top.
How accurate should a software estimate actually be?
A software estimate’s honest accuracy depends on the stage it was made at. A rough-order-of-magnitude estimate at pitch time is −25% to +75%. A budgetary estimate after a product brief is −10% to +25%. A definitive estimate after a 2–4 week paid discovery is −5% to +10%. Anyone offering ±5% without discovery is padding.
Is fixed-bid or time-and-materials better for a startup MVP?
Neither fixed-bid nor pure time-and-materials wins on its own for a startup MVP. The most reliable shape we see is a paid discovery on capped T&M (2–4 weeks, known ceiling), followed by a fixed-bid build with a written change-order SLA. You buy certainty with the discovery and preserve flexibility inside each sprint with an agreed change-budget.
Should I accept an estimate based only on Planning Poker?
No — Planning Poker alone is not enough for a commercial commitment. It is excellent inside a formed team for sprint-level forecasts, but it assumes a backlog of well-defined stories and measured velocity. For a pre-build estimate, cross-check it against a genuinely independent route: an analogous estimate drawn from comparable past builds, set beside a bottom-up WBS priced with 3-point PERT. If those two land within 1.5× of each other you have a defensible number. (PERT is not a third vote — it is the arithmetic applied to the WBS lines.)
How much should the discovery phase cost?
A paid discovery phase costs roughly 5–8% of the total project budget for a greenfield product: $10k–$16k on a $200k build, $27k–$43k on a $540k one. That buys two to four weeks of senior time and delivers a signed user-story map, architecture, NFR brief, risk register and a definitive build estimate. On our own projects the scope it cuts or re-sequences has run 10–25% of the original build estimate, so against a 5–8% price it returns roughly 1.25× to 5× what it costs when it cuts scope. Sometimes it does the opposite and uncovers work the quote had missed: in the edtech mini case in this guide, a $30k discovery exposed 29% that the original $420k quote had not priced. That is still money found before you sign rather than in month four.
How does AI coding affect my software cost estimate in 2026?
AI coding moves the total cost of a typical 12-week greenfield build somewhere between a 4.5% saving and a 2.75% increase in 2026, not the 40%+ shown in marketing. Feature engineering drops 10–15% on greenfield but QA and review grow 15–25% because AI-generated code carries more churn and duplication under flat review (GitClear measured churn rising from 3.3% in 2021 to 5.7% in 2024, and its 2026 follow-up on 623 million changes puts duplicated blocks 81% above the 2023 level). A senior-heavy staff mix reviews that code faster, but it also lifts the blended rate, which is why the net lands near zero.
What is the Cone of Uncertainty in simple terms?
The Cone of Uncertainty is the observation that early software estimates can legitimately be wrong by 4× in either direction, and that the range only narrows as real decisions (scope, architecture, UI, acceptance criteria) are signed. Time alone doesn’t close the cone — decisions do. A four-week-old unsigned scope is just as fuzzy as a four-day-old one.
Can COCOMO II or Function Points estimate a modern cloud product?
COCOMO II and Function Points can estimate a modern cloud product only as a cross-check, never as the primary method. COCOMO II was designed for iterative and reuse-driven development, not waterfall (that was COCOMO 81), but its published coefficients were calibrated on 1990s projects, so an uncalibrated run drifts badly on cloud, microservice and AI-assisted stacks. Function Points are better but still need local calibration. Use bottom-up plus 3-point PERT as your primary, parametric models as a sanity check.
What are the red flags in a vendor’s estimate?
A vendor’s estimate has seven red flags: a single point number, no assumptions list, no exclusions list, no confidence band, no QA or DevOps line, no PM oversight line, and no change-order process. Any two of these together mean the estimate is a quote, not an estimate — the risk will land on you in month three.
What to read next
Process
Shift Left Testing: The 2026 SDLC Quality Playbook
Where the QA line in your estimate actually goes, stage by stage.
Cost guide
Video Streaming App Development Cost: 2026 CTO Guide
Real line items and ranges for the most-miscounted category of software products.
Budget
How to Reduce Software Development Costs: 2026 Playbook
Seven levers that actually reduce burn without degrading the product.
Case study
AI in Software Development: A Measured 2026 Case Study
A measured ~30–40% velocity gain on a 12-year-old platform, and what it does to an estimate.
MVP
MVP Development in 2026: What to Build and What to Cut
MVP thinking is the cheapest route to an estimate you can bank on.
How to turn a wobbly quote into a signed plan
Turning a wobbly quote into a signed plan takes four habits: name the stage of the cone the number came from, price the invisible line items, match the contract shape to the certainty you actually have, and re-forecast every sprint. Software cost estimation is, in the end, a disciplined conversation between scope, certainty and risk, and the tools (analogous, bottom-up, PERT, poker, Monte Carlo) matter less than those four habits. Do those four and your estimate stops being a guess and becomes a plan you can sell to a CFO.
Fora Soft is a software development company that has shipped 250+ products since 2005, and we run this playbook every week on real-time video platforms, AI products and edtech builds. We are happy to apply it to the estimate you are holding right now. The 30-minute Calendly slot below gets you a live walk-through of your existing quote against the five-question decision framework. Bring the PDF; we will mark it up.
Get a second opinion on your software estimate
Free 30-minute review — five questions, marked-up PDF, honest call on whether your current quote is defensible.

