

Quality of Experience is the user-centric measure of a streaming service. It is composed of several measurable dimensions: how fast the video starts (startup time), how often it pauses to buffer (rebuffer ratio), how many viewers abandon before any frame plays (exits before video start), the average video bitrate watched (a proxy for picture quality), the number of ABR quality switches per session (a proxy for visual disturbance), and the rate of playback errors. Together these tell the operator how viewers experienced the service.
QoE is distinct from QoS (Quality of Service), which measures network and infrastructure metrics — bandwidth, latency, packet loss. A network with great QoS can still produce bad QoE if the encoder is wasting bits or the ABR algorithm panics. Conversely, a network with mediocre QoS can produce acceptable QoE if the pipeline is well-tuned to absorb its limitations. The pivot from QoS to QoE in industry thinking happened roughly 2010–2014, driven by Conviva research showing that engagement correlated with experience metrics far more than with network metrics.
QoE is the metric that connects engineering work to business outcomes. Lower rebuffer ratio → longer sessions → more ad impressions and lower churn. Faster startup → fewer abandoned sessions → more revenue per viewer. Every QoE improvement project at every OTT eventually maps to one of these business levers. The whole industry of dedicated video analytics (Conviva, Mux Data, Bitmovin Analytics, NPAW) exists to make QoE measurable and improvable.
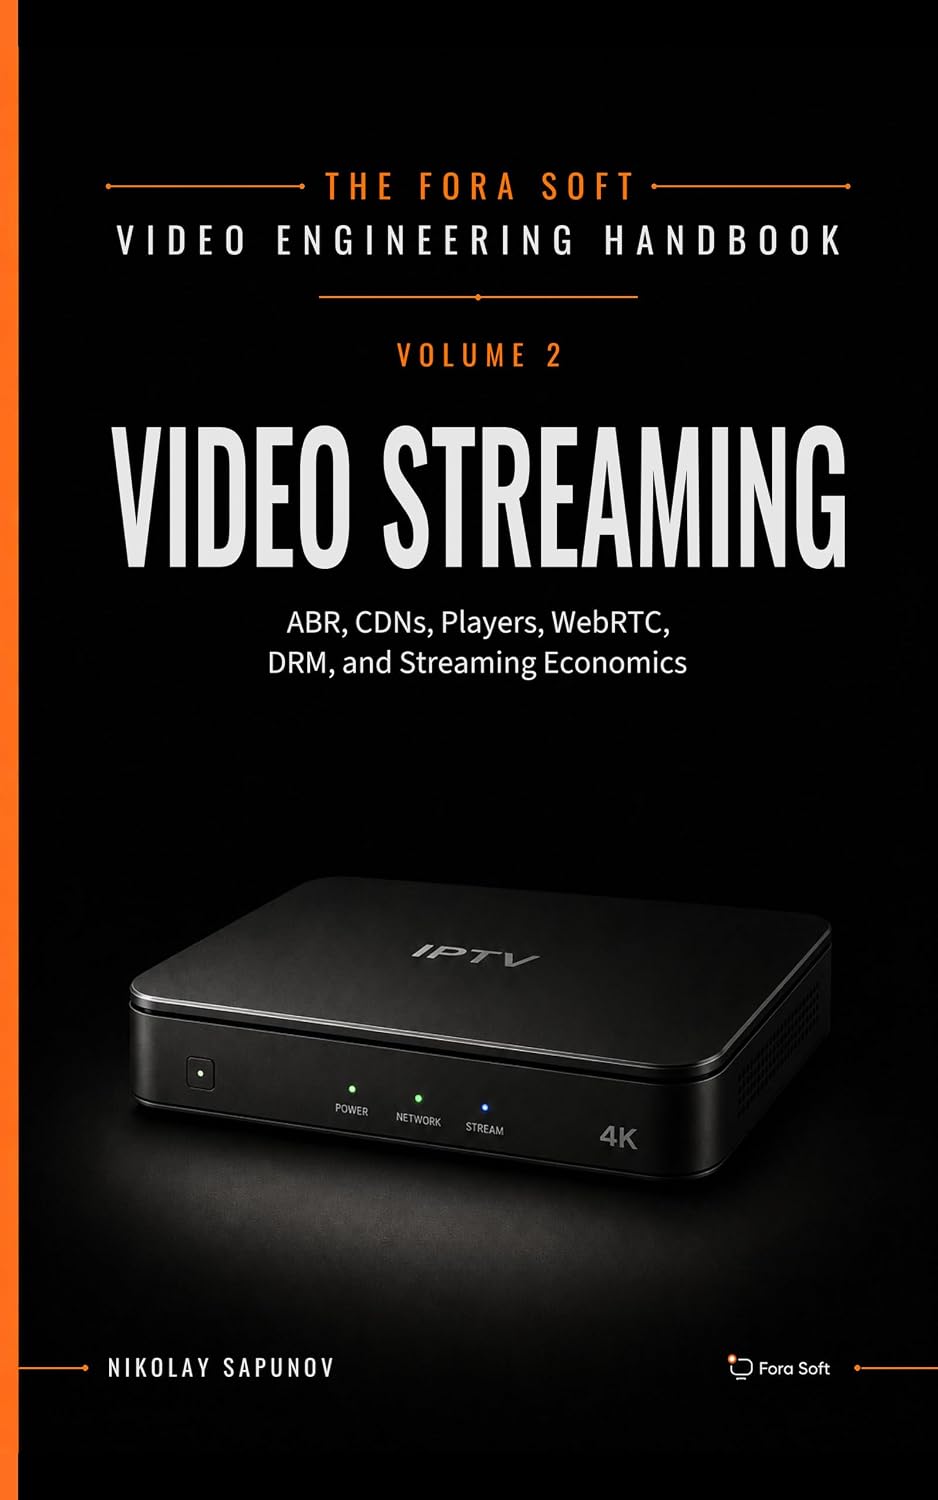
The book · Volume 3 of 7
Video Streaming: A Complete Guide to Video Delivery: From ABR and CDNs to Players, WebRTC, DRM, and the Economics of Streaming
QoE is what viewers feel, and it only improves when startup time, rebuffering, quality and errors are measured per session and tied back to delivery decisions. This volume covers QoE in detail, with player telemetry, ABR behaviour, stall recovery, CDN performance and how QoE maps to the economics of streaming. Written by Nikolay Sapunov, CEO at Fora Soft.
Need a QoE baseline before deciding what to fix in your streaming stack?
We will set up or review your QoE measurement and deliver a baseline report with targets per metric and the delivery changes ranked by impact. 250+ video products shipped since 2005.
