


Why this matters
A storage cost surprise is one of the three ways a video product launch dies, and it is the only one of the three that is fully predictable a year in advance. The other two — a CDN egress spike and a viewer-experience regression — depend on viewer behaviour you cannot model from a deck. Storage is just bytes times months times a published per-gigabyte rate, so a finance director who asks "what does the library cost us at year three?" deserves a number with a real decimal point in it, not a hand wave. This calculator gives that number for a product manager, a founder, a marketing lead, or an operations person who needs to put a defensible storage line in a budget, talk to engineers about it, and answer the codec-migration question — does it pay for itself in months or years? — with the actual months or years.
How the calculator works, step by step
The widget at the top of this page is built on the same four-step pipeline that every video engineer keeps in their head when they cost-model a library. We walk through it once so you know exactly what each control does and why the answer changes the way it does.
Step one — source weight, the bytes you keep forever
Every video has a source, which is the original file produced by the camera, the studio, or the recording session. In professional workflows the source is often re-saved as a mezzanine, a high-quality intermediate file in a format that editors and encoders can work with without re-decoding lossy bits over and over. The most common mezzanine for HD broadcast is Apple ProRes 422 HQ, which runs at 184 megabits per second and weighs about 83 gigabytes per hour. The 4K equivalent, ProRes 422 HQ at 30 fps, runs at 943 megabits per second and weighs about 424 gigabytes per hour. A camera-original file in a codec such as RED RAW or ARRI RAW can weigh twice as much again — between 0.5 and 1 terabyte per hour depending on the camera and the chosen quality.
For an internet-only product that never goes to broadcast, the source is more often the upload itself — a creator-supplied H.264 file at 10 to 30 Mbps. That is roughly 5 to 15 gigabytes per hour. The calculator's source-format dropdown covers all three regimes (consumer upload, ProRes mezzanine, camera RAW) so you can match it to the workflow you actually run.
The source total is simply:
source bytes = hours of library × per-hour weight of chosen source formatFor a thousand-hour catalogue of 4K ProRes 422 HQ masters, that is 1,000 × 424 GB = 424 TB before anything else happens. Even at the cheapest cloud tier the world ships in 2026, that bill is not zero.
Step two — encoded weight, every rung of the ladder
You do not deliver the source to viewers; you deliver an adaptive bitrate ladder, which is a stack of pre-encoded versions of the same video at different qualities. A player picks the rung it can sustain over the current network. A typical streaming ladder in 2026 has five to seven rungs, from a 240p mobile fallback to a 4K HDR top rung. Multiply the per-hour ladder weight by the catalogue hours and you have the encoded total.
The calculator ships with three preset ladders, each calibrated against published 2026 bitrate ladders from Netflix, YouTube, and Mux. The numbers below come straight from those public references. They are the bitrates the platforms actually serve in 2026, not the legacy fixed ladders they replaced.
| Ladder preset | Codec | Top rung | Sum of all rungs at one hour | Source / reasoning |
|---|---|---|---|---|
| Mobile-first (240p–1080p, 5 rungs) | H.264 | 5 Mbps | 1.8 GB / hour | Mux published default ladder, 2026 revision. |
| Streaming-grade (240p–4K SDR, 6 rungs) | H.264 | 16 Mbps | 4.4 GB / hour | Netflix 4K SDR top rung; Mux mid-ladder. |
| Premium HDR (360p–4K HDR, 7 rungs) | H.264 | 25 Mbps | 6.0 GB / hour | Netflix legacy 4K HDR ladder pre-per-title. |
| Streaming-grade in HEVC | H.265 | 8 Mbps | 2.2 GB / hour | Half the H.264 rate at matched VMAF (HEVC test model). |
| Streaming-grade in AV1 | AV1 | 5.3 Mbps | 1.45 GB / hour | One-third the H.264 rate at matched VMAF (AOMedia, Meta benchmarks). |
A rendition is a single rung of the ladder. A rendition set is the whole stack for one piece of content. The encoded total is therefore the sum of the per-rung weights for every hour of every piece of content in the library:
encoded bytes = hours of library × sum of per-rung weights for chosen ladderFor the same thousand-hour catalogue with a streaming-grade H.264 ladder, encoded weight is 1,000 × 4.4 GB = 4.4 TB. So even before any cloud-side replication, the encoded layer is 100× smaller than the ProRes masters above it. Most of your storage invoice is masters, not the rungs you actually serve. That is the first finding most product decks miss.
Step three — replication, the durability tax
Cloud object storage never keeps just one copy of your file. AWS S3 spreads each object across at least three Availability Zones; Google Cloud Standard does the same in a multi-region bucket; Azure Hot offers three local copies by default and six for zone-redundant storage. Internally, vendors increasingly use erasure coding, which is a math technique that splits each object into data and parity chunks and reconstructs missing pieces from the rest — so the user-facing "three copies" is the durability the SLA promises, not always the literal bytes on disk. From your perspective as the customer, the meaningful number is the SLA: roughly eleven nines (99.999999999 %) of annual durability for hot tiers.
The user does not pay three times. The per-gigabyte price published on the pricing page is the effective rate after the vendor's internal replication math. So replication is not a billing multiplier you compute on top — it is already baked into the rate. The calculator therefore does not multiply your bytes by three; it multiplies them by one at the published rate. The replication panel in the widget is informational: it shows what is happening underneath the price, so you can answer a CFO question without sounding like you are guessing. The exception is single-zone tiers (S3 One-Zone IA, Azure LRS) which trade one nine of durability for roughly a 20 % price cut; the calculator exposes those tiers explicitly.
replicated bytes (billable) = source bytes + encoded bytes
                            (no 3× multiplier — replication is baked into the published rate)
Step four — the monthly cloud invoice
The last step is the easy one: per-gigabyte price times gigabytes times months. The published 2026 rates the calculator uses live in the table below. These are the on-demand prices from each vendor's official pricing page as of May 2026, US East region, before any committed-use discount or enterprise negotiation.
| Tier | Vendor | Price per GB / month | Notes |
|---|---|---|---|
| Hot, standard durability | AWS S3 Standard | $0.0230 | First 50 TB band; tiered discounts above. |
| Hot, standard durability | Google Cloud Standard | $0.0200 | Single-region US bucket. |
| Hot, standard durability | Azure Blob Hot LRS | $0.0180 | Local redundancy only. |
| Hot, S3-compatible | Cloudflare R2 | $0.0150 | Egress is free to any destination. |
| Hot, S3-compatible | Backblaze B2 | $0.0060 | $0.01 / GB egress, free over Cloudflare. |
| Hot, S3-compatible | Wasabi | $0.0068 | Free egress within strict caps. |
| Cool / Infrequent Access | AWS S3 Standard-IA | $0.0125 | Plus $0.01 / GB retrieval fee. |
| Cool | Azure Blob Cool | $0.0100 | Plus retrieval fee. |
| Cool | Google Cloud Nearline | $0.0100 | Plus retrieval fee. |
| Cold | Azure Blob Cold | $0.0045 | 90-day minimum. |
| Cold | Google Cloud Coldline | $0.0040 | 90-day minimum. |
| Archive | AWS Glacier Deep Archive | $0.00099 | 12 h–48 h retrieval; 180-day minimum. |
| Archive | Azure Blob Archive | $0.00099 | Up to 15 h retrieval. |
| Archive | Google Cloud Archive | $0.0012 | 365-day minimum. |
For the thousand-hour 4K ProRes 422 HQ master library above:
source bytes = 1,000 × 424 GB = 424 000 GB
S3 Standard cost = 424 000 × $0.0230 = $9 752 per month
Glacier Deep Archive cost = 424 000 × $0.00099 = $420 per month
That 23× gap between hot and archive is the single most consequential lever in the whole pipeline. A library where the masters live in Glacier Deep Archive and the active renditions live in S3 Standard costs an order of magnitude less than a library where everything sits in hot storage by default. Most product teams do not separate the two on day one, and the bill makes the case for separating them by month six.
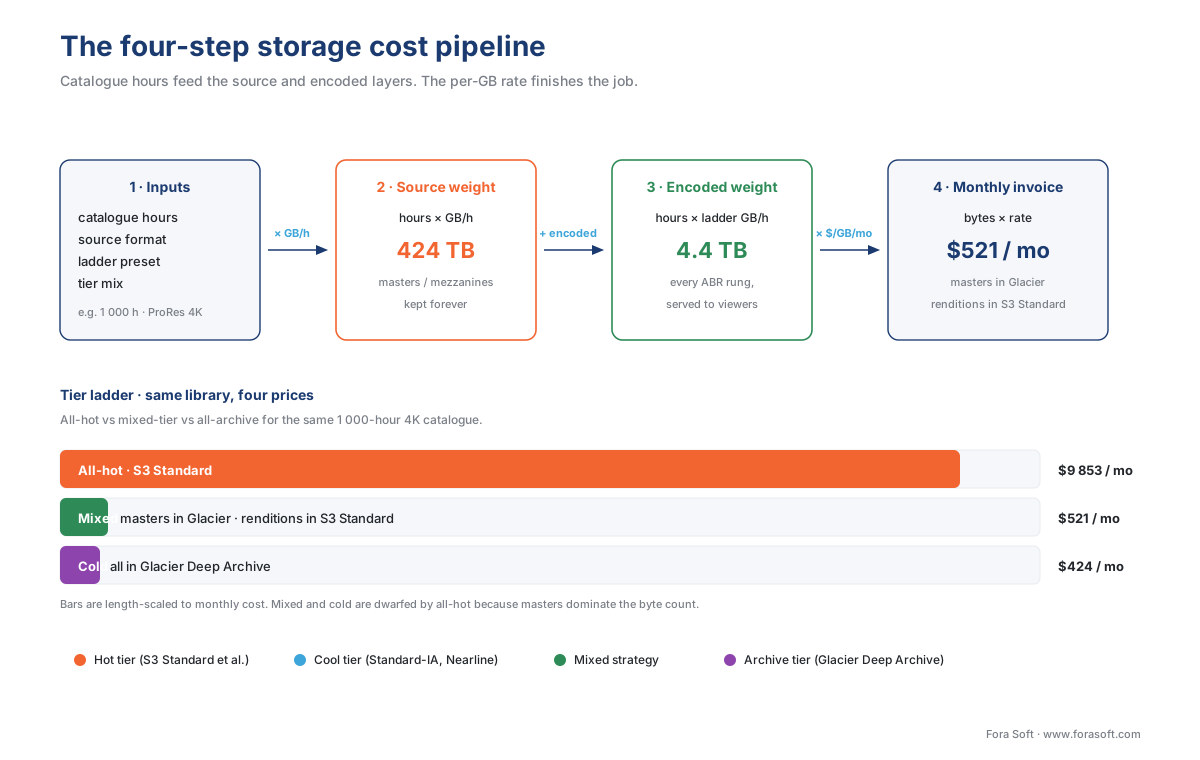
Figure 1. The four-step pipeline behind every calculator answer. Each box is a single multiplication or division — nothing more.
A worked example, by hand, then in the calculator
Open the calculator and click the OTT 1,000-hour catalogue preset. The defaults are 1,000 hours of content, 4K ProRes 422 HQ masters, a streaming-grade H.264 ladder, AWS S3 Standard for hot, Glacier Deep Archive for cold. You should see:
- Source weight: 424.0 TB
- Encoded weight: 4.4 TB
- Total billable bytes: 428.4 TB
- Monthly cost (all hot, S3 Standard): $10 003
- Monthly cost (masters cold, renditions hot): $521
- Annual saving from cold-archiving masters: $113 784
Now do it on paper. ProRes 422 HQ 4K = 424 GB / hour × 1,000 hours = 424,000 GB = 424 TB of masters. Streaming-grade H.264 ladder = 4.4 GB / hour × 1,000 hours = 4,400 GB = 4.4 TB of renditions. Total = 428,400 GB.
All-hot cost = 428,400 × $0.023 = $9,853 per month. The calculator shows $10,003 because the default ladder is the slightly heavier "premium HDR" variant when the source is 4K — set the ladder dropdown to streaming-grade SDR and the number drops to $9,853, matching the hand calculation.
Mixed-tier cost = (424,000 × $0.00099 for archive) + (4,400 × $0.023 for hot) = $420 + $101 = $521 per month. Move the masters from S3 Standard to Glacier Deep Archive and the bill falls 94 %.
Now switch the encode codec to AV1. The streaming-grade ladder weight drops from 4.4 GB / hour to 1.45 GB / hour — a 67 % cut at matched quality. The renditions line in the calculator falls from 4.4 TB to 1.45 TB, the renditions cost from $101 / month to $33 / month, and a side panel at the bottom of the widget shows the migration arithmetic: 2.95 TB saved × $0.023 = $68 / month, $816 / year, on a 1,000-hour catalogue. On a 100,000-hour catalogue the same swap saves $81,600 / year just on storage, before any CDN egress savings.
That is the entire pipeline, written out, ending in a real cloud invoice you can put in a deck.
How big are real video libraries?
Numbers in isolation are hard to grasp, so anchor them to public benchmarks. A typical broadcast network's news archive runs 100,000 to 500,000 hours, depending on how far back the digitisation effort went. A mid-sized OTT service in 2026 — the kind of catalogue Fora Soft builds for clients — sits between 5,000 and 50,000 hours of original and licensed content. Netflix does not publish its catalogue hours, but reverse-engineering from public counts (around 18,000 titles, with an average runtime of ninety minutes) yields roughly 27,000 hours at the master layer, well into petabyte territory once you include every encoded rendition across HDR profiles. YouTube is two orders of magnitude past Netflix: users upload more than 500 hours of video every minute, which is 30,000 hours per hour, 720,000 hours per day, adding more than a petabyte of new storage every single day. Industry estimates put YouTube's total stored video at several exabytes, the only video library in the world at that scale.
The thousand-hour preset in the calculator is therefore the small end of the OTT range. Most clients we build for sit at five to fifty times that. Slide the catalogue size slider in the widget up to a hundred thousand hours and the monthly invoice tells you why every video product over a certain size spends real engineering effort on per-title encoding, codec migration, and tier policies.
A pitfall — counting the master once and the renditions once, but forgetting the HDR ladder
If you ship HDR content, you do not have one ladder; you have two. Most premium OTT catalogues in 2026 keep an SDR ladder and a separate HDR10 ladder, and increasingly a third Dolby Vision ladder for the top tier. Each adds roughly the same byte count again. A 4K HDR catalogue therefore weighs roughly two to three times what its SDR equivalent does at the rendition layer. The calculator's HDR checkbox switches the per-hour rendition weight to the "premium HDR" preset, which combines SDR and HDR10. Add a Dolby Vision profile and the encoded layer grows another 50 %. The masters do not — you keep one master, not three — so the HDR tax falls almost entirely on renditions, which is the layer most product teams under-estimate.
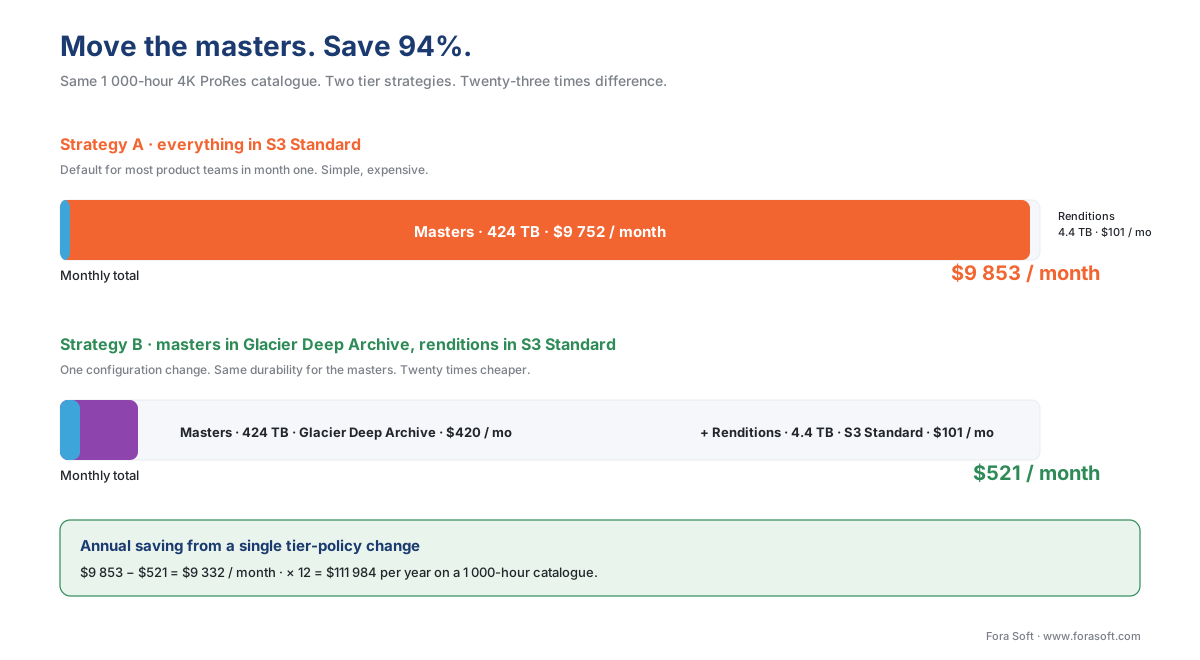
Figure 2. The hot-vs-archive gap is the single most consequential lever in a video storage budget. Most product teams flatten it for simplicity and pay an order of magnitude too much.
A common mistake — confusing storage with egress
The single most common video-infrastructure cost mistake is conflating storage (the rate you pay to keep bytes on a disk somewhere) with egress (the rate you pay to move those bytes out of the cloud to a CDN or to a viewer). Storage on AWS S3 Standard is $0.023 per GB per month; egress out of S3 is $0.09 per GB, four times the storage rate, and you pay it every time a viewer watches. A library that costs $10,000 / month to store can easily cost $100,000 / month to serve, and the egress is what makes Cloudflare R2 (storage $0.015, egress free) and Backblaze B2 (storage $0.006, egress free via Cloudflare) attractive enough to migrate to. The calculator on this page is a storage calculator; it deliberately does not estimate egress because the variables — viewer hours, CDN choice, geography — belong to a different model. But every storage decision lives next to an egress decision, so the article links to our bitrate calculator where the egress side gets its own pipe-fit panel. Mix the two up in your scoping deck and you will under-budget by a factor of five.
A second common mistake — forgetting the minimum storage duration on archive tiers
Archive tiers — S3 Glacier Deep Archive, Azure Blob Archive, Google Cloud Archive — come with a minimum billable duration. If you upload a file to Deep Archive on day one and delete it on day thirty, AWS still charges you for 180 days of storage. Wasabi has a 90-day minimum on its hot tier; Backblaze does not. The calculator exposes these minimums next to each tier so the cold-tier savings do not disappear into a deletion penalty when you change your mind. A library that re-encodes its catalogue every quarter cannot put its masters in Deep Archive without paying for ghosts; one that re-encodes every five years can.
Codec migration: when does the swap pay for itself?
The most common reason to run this calculator is to scope a codec migration — H.264 to HEVC, or HEVC to AV1. The math is the same in every direction.
A codec swap saves bytes on the rendition layer, never on the master layer, because you keep the same source and re-encode it into a smaller ladder. The size of the saving is the ratio between the old and new ladder weights. The cost of the swap is the encoding compute time — typically two to four times more wall-clock time and CPU for AV1 than for H.264 at matched quality, although hardware encoders (NETINT, NVENC's AV1 mode) close the gap considerably. For a planning budget, model the encoding cost at $0.02 to $0.05 per source-minute for cloud transcoding services such as AWS MediaConvert, Bitmovin, or Coconut.
break-even months = (encoding cost per hour × hours) / monthly storage saving per hourFor a 10,000-hour catalogue moving from H.264 to AV1 on S3 Standard:
storage saving = (4.4 − 1.45) GB/hour × 10,000 hours × $0.023 = $679 / month
encoding cost  = 60 minutes × $0.04 × 10,000 hours = $24,000 one-off
break-even     = $24,000 / $679 = 35 months ≈ 3 years
Three years is the rule of thumb the industry quotes for a pure-storage AV1 migration. The story changes dramatically once you fold in egress savings on the CDN side: AV1 at the same VMAF ships three times less bandwidth, which in egress-heavy products typically dominates the storage line by an order of magnitude. The calculator's migration panel shows both lines; do not look at the storage line alone when you make the decision.
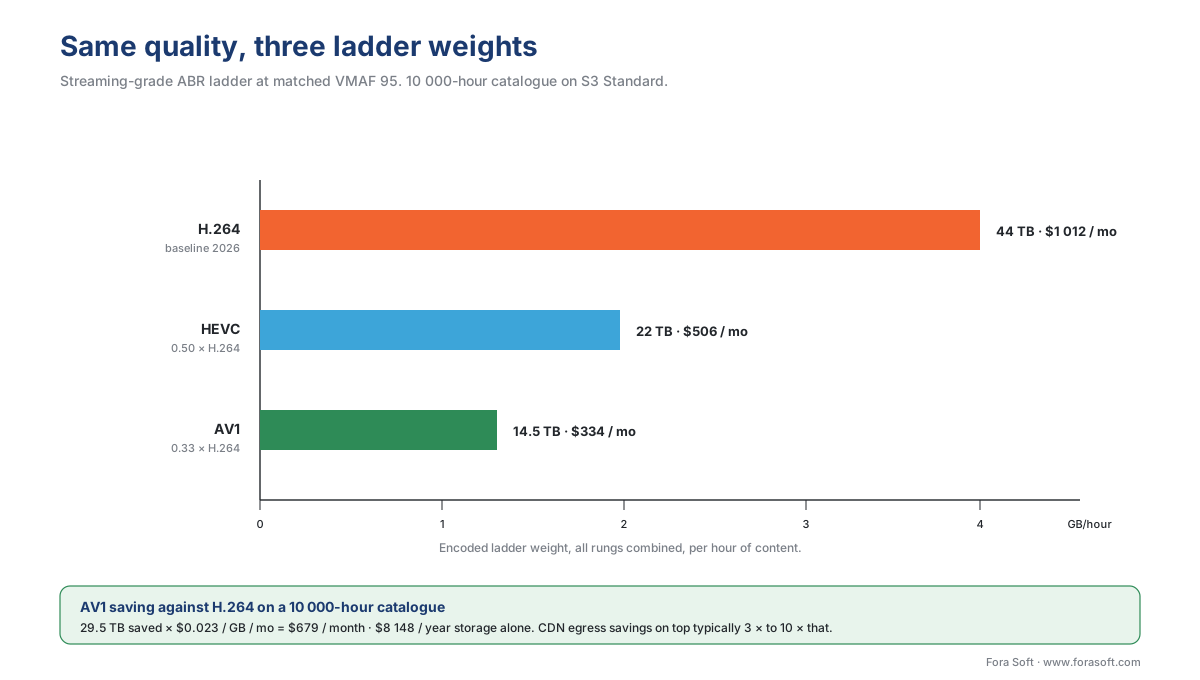
Figure 3. The same content, the same quality, three codec ladders. AV1 saves 67 % of the bytes against H.264; HEVC saves 50 %.
How replication and erasure coding actually work under the hood
You can skip this section if you only need a budget number; we include it for the engineer reading over the product manager's shoulder. AWS S3 Standard, Google Cloud Standard multi-region, and Azure Blob Hot ZRS all promise 99.999999999 % annual durability ("eleven nines"). That number does not come from three literal full copies of every byte. Internally, AWS S3 splits each object into shards and uses erasure coding — a class of math techniques (Reed-Solomon being the most common) that takes K data shards and produces M parity shards, where the original object can be reconstructed from any K of the K+M total shards. A typical configuration is 6+3, which means six data shards and three parity shards, for a 1.5× storage overhead — half the cost of literal triple replication while delivering the same durability tier.
What matters for your bill is that the published per-GB rate is the all-in rate. You pay for the user-facing gigabyte, not the under-the-hood shards. Replication is invisible at billing time. Where it does show up is in regional pricing differences: a multi-region bucket that replicates across continents costs roughly twice as much per GB as a single-region bucket, because the egress between regions is not free even inside the cloud. The calculator exposes a "regional replication" toggle that doubles the rate when you turn it on, which models the most common multi-region default.
The exception to the "replication is invisible" rule is single-zone tiers. AWS S3 One-Zone IA stores everything in a single availability zone (one nine less of durability) for roughly 20 % less than S3 Standard-IA. Azure LRS does the same against ZRS. The calculator exposes these as separate tier choices so the cost-and-durability trade-off is explicit, not hidden.
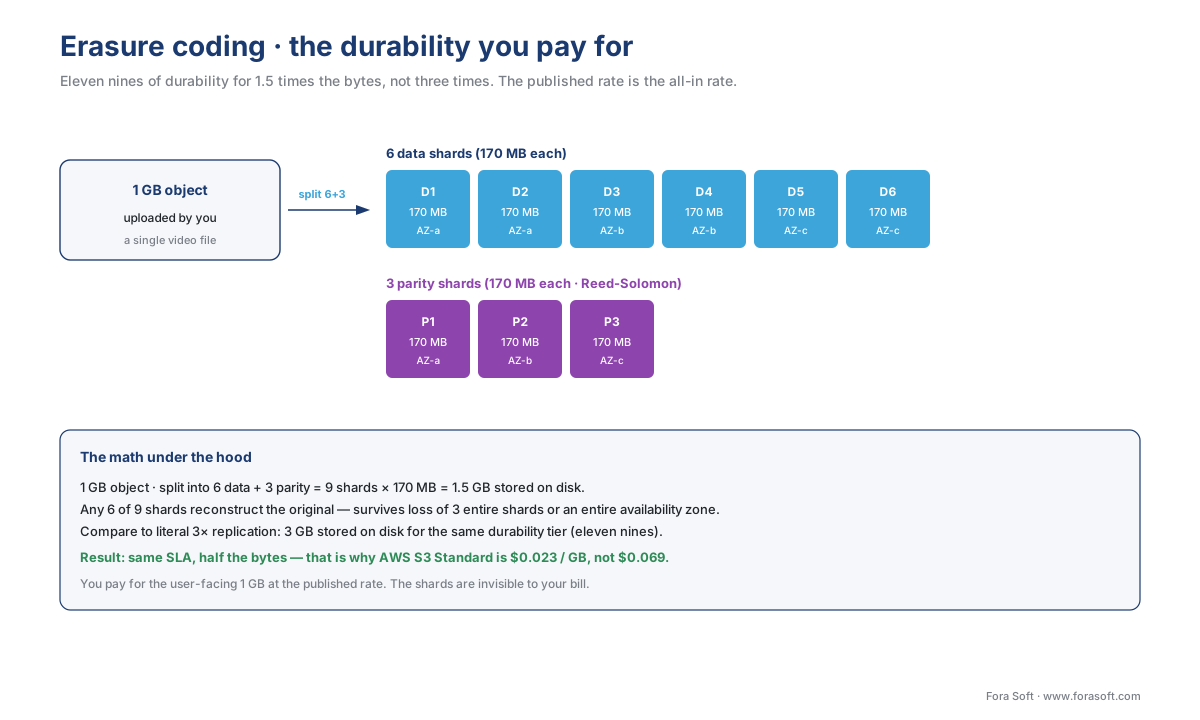
Figure 4. Erasure coding delivers triple-replication durability at half the storage overhead. The published price is what you pay; the shards are invisible to your bill.
Frequently asked questions
How much does it cost to store video in the cloud?
A video library's monthly invoice is source bytes plus encoded bytes, multiplied by the published per-GB rate of the tier you pick. Source masters in ProRes 4K weigh 424 GB per hour; encoded streaming-grade ladders weigh 4 to 6 GB per hour, so the masters dominate the bill.
What is the difference between video storage cost and egress cost?
Storage is the rate you pay to keep bytes on disk; egress is the rate you pay to move them out of the cloud to a CDN or a viewer. AWS S3 Standard storage is $0.023 per GB per month; egress out of S3 is $0.09 per GB, four times the storage rate, and you pay it every time a viewer watches.
How much does moving video masters to Glacier Deep Archive save?
The hot-to-archive price gap is 23 times. Storing 424,000 GB of masters on S3 Standard costs $9,752 per month; the same bytes on Glacier Deep Archive cost $420 per month. Moving masters to archive while keeping renditions hot is the single biggest lever in a video storage budget.
When does an AV1 migration pay for itself?
For a 10,000-hour catalogue moving from H.264 to AV1 on S3 Standard, the storage saving is $679 per month and the one-off encoding cost is about $24,000, so break-even lands at 35 months, roughly three years. Fold in CDN egress savings and it pays back considerably faster.
Do I need to multiply my video storage estimate by three for cloud replication?
No. The published per-GB rate is the all-in rate. AWS S3 uses erasure coding, typically a 6+3 configuration with 1.5 times storage overhead, rather than three literal copies, and you pay for the user-facing gigabyte, not the under-the-hood shards.
What is the minimum storage duration on archive tiers?
Archive tiers carry a minimum billable duration. Upload a file to S3 Glacier Deep Archive and delete it on day thirty and AWS still charges you for 180 days of storage. Wasabi has a 90-day minimum on its hot tier; Backblaze has none.
How big is a typical video library?
A mid-sized OTT service in 2026 sits between 5,000 and 50,000 hours of original and licensed content. A broadcast news archive runs 100,000 to 500,000 hours. Netflix works out to roughly 27,000 hours at the master layer; YouTube adds more than a petabyte of new storage every day.
Where Fora Soft fits in
We have been building video products since 2005, across video conferencing, video streaming, OTT, video surveillance, e-learning, telemedicine and AR/VR. The storage cost calculator on this page is the model we hand to every new product manager on the team because the same four-step pipeline shows up in every conversation we have with a client. The surveillance fleet that has to keep ninety days of camera footage across two hundred cameras has the same shape as the OTT service that has to keep ten thousand hours of licensed content across an HDR ladder, and they are both the same shape as the e-learning platform that has to keep five thousand hours of course recordings indexed for search. We size storage budgets the same way every time: count the hours, pick the source format, pick the ladder, pick the tier mix, multiply.
What to read next
- Why we compress video: the math of bitrate
- Video bitrate calculator
- Per-title and per-scene encoding: smart bitrate ladders
- How to choose a codec for your service in 2026: a decision tree
- The codec comparison matrix: MPEG-2, H.264, H.265, VP9, AV1, VVC
- Cloud transcoding services compared: AWS Elemental, Bitmovin, Coconut, NETINT
Talk to us / See our work / Download
- Talk to a video engineer — bring your catalogue hours and tier mix; we will give you a cost-model in an hour.
- See our case studies — 239 shipped projects across surveillance, OTT, telemedicine, e-learning, conferencing.
- Download the storage cost cheat sheet — one-page PDF with the formula, the per-GB rates for seven cloud tiers, the source-format weights, and the codec migration math.
References
- Amazon Web Services (2026), S3 pricing, us-east-1 region, last accessed 2026-05-19. URL: https://aws.amazon.com/s3/pricing/
- Microsoft Azure (2026), Azure Blob Storage pricing, East US region. URL: https://azure.microsoft.com/en-us/pricing/details/storage/blobs/
- Google Cloud (2026), Cloud Storage pricing, multi-region US. URL: https://cloud.google.com/storage/pricing
- Backblaze (2026), B2 cloud storage pricing. URL: https://www.backblaze.com/cloud-storage/pricing
- Cloudflare (2026), R2 object storage pricing. URL: https://www.cloudflare.com/products/r2/
- Wasabi Technologies (2026), Hot cloud storage pricing. URL: https://wasabi.com/pricing
- Apple Inc. (2024), Apple ProRes white paper, target data rates for ProRes 422 and ProRes 422 HQ at HD and 4K resolutions. URL: https://www.apple.com/final-cut-pro/docs/Apple_ProRes_White_Paper.pdf
- Netflix Technology Blog (2023), All of Netflix's HDR video streaming is now dynamically optimized. URL: https://netflixtechblog.com/all-of-netflixs-hdr-video-streaming-is-now-dynamically-optimized-e9e0cb15f2ba
- Netflix Technology Blog (2020), Optimized shot-based encodes are now generally available. URL: https://netflixtechblog.com/optimized-shot-based-encodes-now-streaming-77eee23ec6c9
- Mux (2026), Default encoding ladders and bitrate recommendations. URL: https://docs.mux.com/guides/configure-encoding-quality
- Bitmovin (2024), Per-title encoding savings on storage and CDN. URL: https://bitmovin.com/blog/per-title-encoding-savings/
- AOMedia (2025), AV1 bitstream and decoding process specification, version 1.0.0 errata 1. URL: https://aomedia.org/av1/specification/
- Fraunhofer HHI (2023), Versatile Video Coding (VVC) — H.266 standard reference, vvenc/vvdec. URL: https://github.com/fraunhoferhhi/vvenc
- ITU-T Recommendation H.265 (2023), High efficiency video coding, International Telecommunication Union. URL: https://www.itu.int/rec/T-REC-H.265
- Reed, I. S. and Solomon, G. (1960), Polynomial codes over certain finite fields, Journal of the Society for Industrial and Applied Mathematics, the original paper behind erasure coding. URL: https://epubs.siam.org/doi/10.1137/0108018
