


Key takeaways
• Track attention, not emotion. Gaze, head pose, and on-screen dwell time are legal, unbiased, and predictive; emotion inference is banned in EU education under the AI Act and is only 50–60% accurate on diverse classrooms.
• Only 12–15% of online learners finish. Analytics move that number only when paired with human intervention — Georgia State’s early-alert system plus adviser outreach lifted its six-year graduation rate 22 points. A dashboard no one acts on doesn’t help.
• Edge-first beats cloud-first. MediaPipe + ONNX on the learner’s device hits sub-500ms latency, keeps facial frames off your servers, and cuts cloud spend by 80%+ vs. running AWS Rekognition on every minute of class.
• Integrate, don’t silo. Ship over LTI 1.3 + xAPI into Canvas, Moodle, and Open edX; 72% of institutions already struggle with data fragmentation, so another dashboard won’t win the RFP.
• MVP in 10–14 weeks with Agent Engineering. An LTI-integrated engagement analytics module — gaze tracking, cohort heatmaps, at-risk alerts, FERPA-compliant storage — is typically $38k–$65k with Fora Soft’s AI-augmented delivery.
Why Fora Soft wrote this playbook
Fora Soft is a software development company that’s been shipping video-heavy products since 2005 — 250+ projects, 21 years of real-time video and AI, and a specialization that keeps coming back to the same triangle: video streaming, computer vision, and machine learning. The EdTech slice of our work — virtual classrooms, interactive lecture platforms, AI tutors, proctoring tools — is where engagement analytics lives in practice, not in slides.
A few reference points from our e-learning practice: the BrainCert virtual classroom (WebRTC, SOC 2 + ISO 27001, millions of learners); Scholarly in Asia-Pacific (15,000+ active users, classes of up to 2,000 concurrent participants, named the most innovative EdTech startup in APAC by AWS); the Career Point AI coaching platform built with the University of Oxford that raised $1.4M after launch. We’ve wired attention analytics, auto-captioning, recommender systems, and cohort heatmaps into every one of them — so this article is the distilled what-actually-works.
We also use AI heavily on our own engineering side (Agent Engineering), which is why our numbers land lower than the typical agency quote. We’ll flag honest cost ranges; when we’re not sure, we won’t throw a number at the wall.
Need a second opinion on your engagement analytics stack?
30-minute call with a senior EdTech architect — we’ll review your LMS, pick the lightest viable AI stack, and flag the FERPA/EU-AI-Act traps before you ship.
What AI video analytics in online learning actually does
Strip away the marketing and the technology does three jobs. Detect — who is looking at the screen, who isn’t, who just yawned, who switched tabs. Predict — which learners are drifting toward the dropout band, which lesson minutes are killing the class, which cohort is confused. Trigger — send the teacher a nudge, surface a remedial clip, change pacing, or flag a student for human follow-up.
The inputs are mundane: the webcam stream the student is already granting for the class, plus the video of the lecture itself, plus the LMS clickstream. The outputs are a small number of signals (engagement score, attention curve, drop-off points, anomaly events) that educators, course designers, or adaptive systems can actually act on.
The four families of signals worth collecting
1. Gaze and head pose. Where are the eyes pointed? Is the head turning away? This is the safest, most defensible engagement signal — it’s a behavioral observable, not an inference about inner state. MediaPipe Face Landmarker (the current successor to Face Mesh and Iris) runs at 30 FPS on CPU and produces usable data without any cloud call.
2. Presence and motion. Is the student there? Is another person walking through the frame? Did they leave for five minutes? Blink rate as a fatigue proxy. Head nodding as a cadence cue. These are cheap to compute and low-risk to report.
3. Lecture video analytics. Where in the video do most students rewind? Where do they drop off? Which quiz follows which clip? This is the most underrated signal — it’s attached to content, not to individual biometric data, so it carries almost no compliance weight.
4. Apparent expression (careful). Smile detection, surprise, confusion. Under the EU AI Act this is the line between “detecting readily apparent expressions” (allowed) and “inferring emotional state” (prohibited in education). Collect sparingly, label carefully, and never feed it into a decision that affects a student’s grade or access.
Reach for gaze + dwell time when: you need a single engagement KPI that survives GDPR, FERPA, and the EU AI Act without a 50-page DPIA. Skip emotion inference unless you have a medical-grade use case and written clinical validation.
The numbers the board will ask about
Two markets collide in this product category, and both are growing fast enough to make the business case without heroic assumptions.
AI-in-Education is projected to grow from $6.90B (2025) to $41.01B (2030) — a 42.83% CAGR per The Business Research Company. The adjacent AI Video Analytics market is $8.67B (2025) rising to $46.51B (2034) at 20.52% CAGR per MarketResearchFuture. Whichever side of the fence you’re on, the underlying demand is the same: learners want video, institutions want measurable outcomes, and neither scales without automated analytics.
The pain the analytics solve is concrete. Average online course completion sits at 12–15% — worse than in-person (a figure consistent across MOOC completion research and recent industry surveys). The first two weeks are decisive; after week 2 engagement gaps between finishers and dropouts collapse to under 3%, so any intervention that arrives later is mostly cosmetic. Institutions already sitting on engagement data aren’t turning it into decisions: 72% of them struggle with data fragmentation across LMS, video platform, and SIS (EDUCAUSE, 2025).
When the analytics land with a workflow, the outcomes follow. The best-documented case is Georgia State University: its early-alert analytics — 800+ risk triggers routed to advisers who then intervened — lifted the six-year graduation rate from 32% to over 54% (a 22-point gain, 2003–2017) and closed the achievement gap for at-risk cohorts. Purdue’s Course Signals early-warning system reported comparable retention gains a decade earlier. Those programs read academic signals rather than webcam video, but the pattern is identical to engagement analytics: the lift comes from humans acting on the flags, not from the dashboard itself. A dashboard no one opens returns zero.
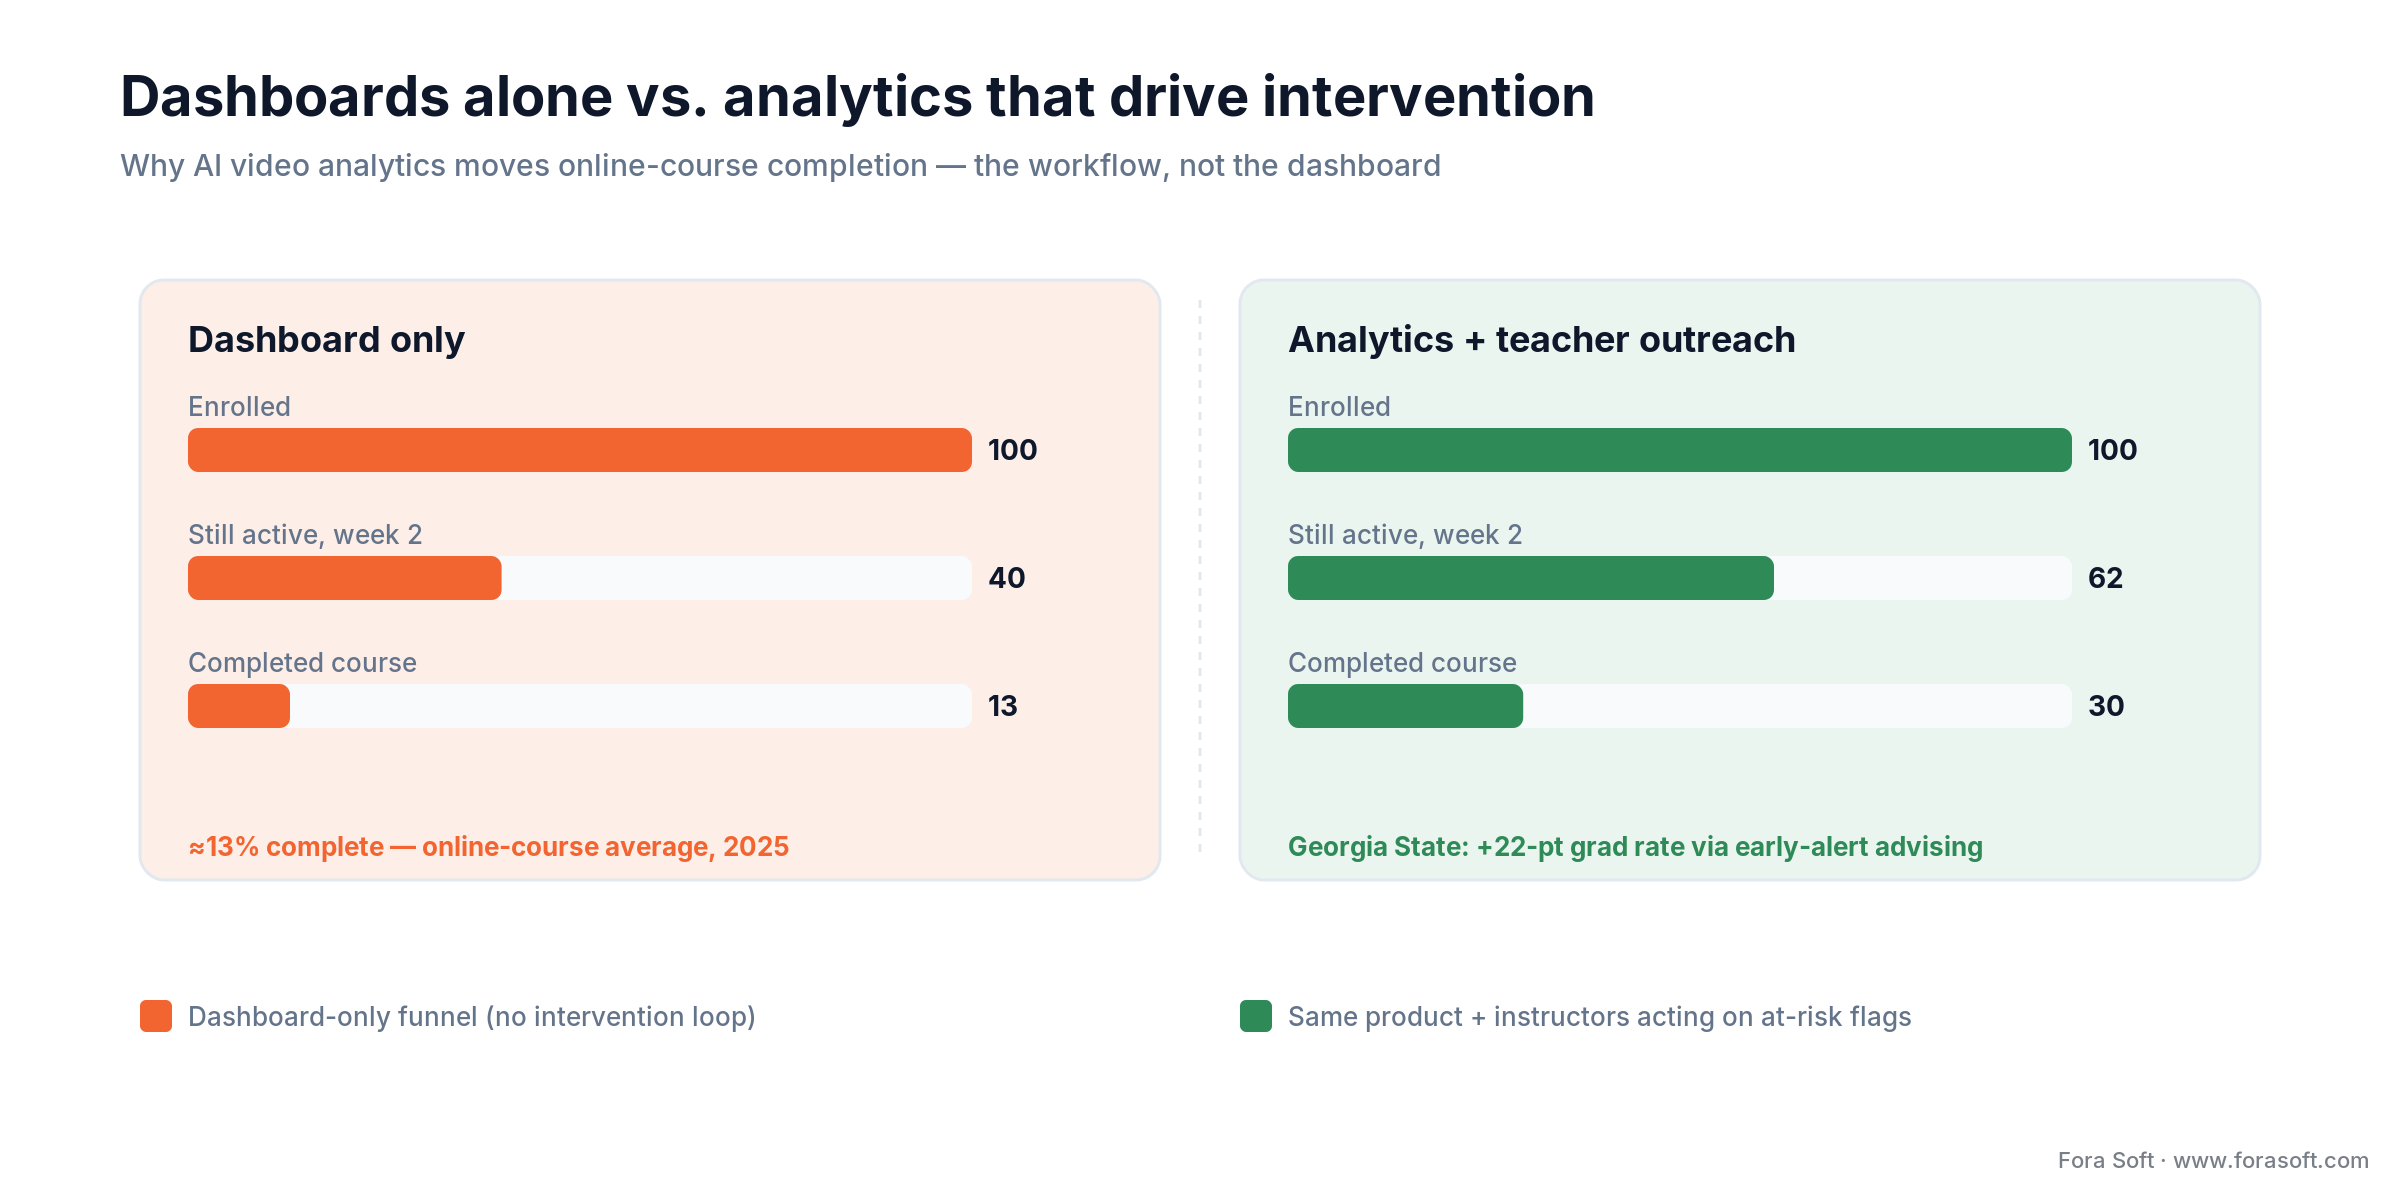
Figure 1. Completion lifts come from the intervention loop, not the dashboard — the same product moves the numbers only when instructors act on at-risk flags.
Reference pipeline: from webcam frame to LMS dashboard
Every working engagement analytics system we’ve shipped lays out roughly the same way. Five stages; each stage is swappable; the split between edge and cloud is the single most important design decision.

Figure 2. The reference pipeline we ship: stages 1–3 run on the learner’s device, and only a per-minute engagement score crosses the biometric boundary to the cloud.
| Stage | What it does | Typical tooling | Where it runs | Latency target |
|---|---|---|---|---|
| 1. Capture | Webcam + lecture video ingest | WebRTC, getUserMedia, HLS/LL-HLS for lecture | Browser / mobile | < 150 ms glass-to-glass |
| 2. Vision primitives | Face detection, landmarks, gaze, head pose | MediaPipe Face Landmarker, OpenFace, ONNX Runtime | On-device (preferred) | < 33 ms per frame |
| 3. Feature rollup | Per-minute engagement score from raw signals | Sliding-window aggregates, lightweight CNN/LSTM | On-device or edge worker | 1 score / minute |
| 4. Predict & alert | Drop-off / at-risk classification, anomaly detection | PyTorch models, gradient-boosted trees, Vertex AI | Cloud (aggregated only) | < 2 s |
| 5. Delivery | LMS dashboards, xAPI statements, teacher alerts | LTI 1.3, xAPI / cmi5, webhooks, Slack/Teams bots | Cloud | Real-time / nightly batch |
The rule we apply by default: raw biometric frames never leave the student’s device. Stages 1–3 run on-device; only scored, aggregated signals cross the wire. That alone removes the majority of your GDPR, FERPA, and BIPA surface area, and it cuts cloud spend by 80%+ compared to shipping every frame to AWS Rekognition or Azure Video Indexer.
Stack comparison: open-source vs. cloud APIs vs. specialized vendors
Most teams we talk to over-rotate on cloud APIs because they’re easy to wire up in a weekend. The math catches up to them around minute 20,000 of processed video. Here’s how the three tiers actually compare in 2026 pricing and capability.
| Stack | What’s in it | Cost shape | Privacy posture | Best for |
|---|---|---|---|---|
| MediaPipe + TF/ONNX (OSS, on-device) | Face Landmarker, Pose Landmarker; custom classifier on top | $0 per minute at runtime; 2–4 engineer-weeks to integrate | Strongest — no biometric egress | K12, higher ed, EU customers |
| AWS Rekognition Video | Face + label detection, Face Liveness for proctoring | ~$0.10/min stored-video analysis (2026), tiered toward ~$0.04 at volume | Weaker — frames leave device; BAA available | Batch post-processing of lectures, proctoring |
| Google Cloud Video Intelligence | Labels, shot detection, explicit-content, speech | ~$0.10/min labels + transcription; 1,000 min/mo free tier | Similar to AWS; DLP available | Content analytics on lecture VOD |
| Azure Video Indexer | Scenes, transcript, OCR, face ID, keyframes | Per-minute + per-transaction (opaque; request quote) | Enterprise Azure DPA; EU regions available | Institutions already on Microsoft stack |
| Hume AI / Affectiva / Smart Eye | Specialized expression / gaze / emotion models | Enterprise licensing (B2B; no public per-min rate) | Depends on DPA — emotion data high-risk under GDPR | Medical/clinical EdTech, research labs |
| Roboflow / Clarifai custom | Custom CV pipelines, model hosting | Platform fee + per-inference; varies widely | Depends on deployment (self-host possible) | Domain-specific models (e.g., hand-raising, whiteboard) |
Reach for MediaPipe on-device when: you process more than 5,000 concurrent student-minutes per day, your customers include any EU institution, or compliance review is a named GTM risk. Reach for cloud APIs when you only need post-hoc VOD analytics on fewer than ~20,000 minutes/month and have a solid DPA chain in place.
The four engagement strategies that actually move completion
Every AI video analytics product we’ve shipped sooner or later consolidates around the same four strategies. The ones that look impressive in a demo and don’t survive contact with real learners we’ve left on the cutting room floor.
Strategy 1 — Real-time attention nudges
How it works. On-device gaze + head pose feed a sliding-window score. When a student’s attention dips below threshold for N consecutive minutes, the app surfaces a gentle UI nudge (“Still with us?”) or a micro-quiz that re-engages without shaming. The data never leaves the device; only aggregate events are logged.
What it avoids. Public-shaming teacher dashboards, in-session “you looked bored” callouts, and anything that presumes emotion. Nudges have to feel like a supportive teaching assistant, not a hall monitor.
Strategy 2 — Content-level drop-off analytics
How it works. Record per-second dwell, rewind, and fast-forward on every lecture clip across the whole cohort; render a heatmap over the video timeline. The course designer sees where 40% of students rewound minute 7:20, and rewrites or splits that segment. No biometric data involved — this is pure VOD instrumentation.
Why it wins. This is the single most underrated intervention. It changes the content rather than the student; the lift is structural and compounding; and it’s completely compliance-neutral. We ship it before anything else in every new LMS project.
Strategy 3 — At-risk learner detection
How it works. Blend engagement score, quiz performance, login cadence, and late-submission pattern into a gradient-boosted model that flags learners likely to drop within 14 days. Alerts go to the instructor, not to the student — humans decide the outreach.
What makes it work. The model is only the messenger; the intervention is a human phone call or a restructured study plan. Institutions that treat it as a dashboard without outreach see zero lift; institutions that route flags to tutors weekly see the Georgia-State-scale retention gains.
Strategy 4 — Adaptive content pacing (advanced)
How it works. Short-loop adaptation: if the cohort’s engagement drops below a threshold in the first minute of a new concept, insert a reinforcement clip or a scaffolding quiz; if engagement is high and quiz scores prove mastery, skip the reinforcement. Requires an intelligent tutoring layer and tightly scaffolded content.
Watch out. This is the strategy with the most compliance risk because the AI’s output changes what the student experiences. Never auto-penalize; never gate credentials on engagement; always keep a teacher in the loop for decisions that affect grades.
Completion rate stuck in the 10–15% band?
Bring your LMS + lecture metrics; we’ll map which of the four strategies will move the needle for your learners, with a 2-week proof-of-value plan.
Compliance: the law you can’t patch in sprint 14
Every founder we meet eventually asks the same question: “can we just add consent later?” The honest answer is no. Five frameworks bite hardest for engagement analytics, and the architectural choices to satisfy them are the ones you make in week one.

Figure 3. Behavioral signals (gaze, presence, dwell) are defensible across frameworks; inferred emotion is a product-killer in EU education under Article 5 of the AI Act.
FERPA (US, K–12 and higher ed)
Facial geometry and engagement scores linked to a student ID are education records. Schools can collect them in-house; vendors need a Data Processing Agreement or school-official designation. Practical rule: contractually bind yourself to the school’s data policies, don’t cross-sell data, and honor deletion requests within 30 days.
COPPA (US, under-13)
Schools collecting for educational purposes are largely exempt. Vendors that want to resell, target ads, or profile for anything outside instruction trigger COPPA regardless — and civil penalties run up to $53,088 per violation (FTC inflation-adjusted, 2025). Safe play: disable any commercial secondary use by default for any school-account user.
GDPR (EU + residents)
Biometric data is a special category, and emotion inference is almost always a high-risk processing activity requiring a DPIA. Explicit, granular, opt-in consent is non-negotiable; broad “we may use your data for analytics” clauses are void. Edge processing with aggregated outputs collapses most of the scope.
EU AI Act (effective Feb 2025, full enforcement 2026)
Emotion recognition in education is prohibited — Article 5. Detecting “this student is smiling” is allowed; inferring “this student is frustrated” is not. Any pipeline that funnels an inferred emotion into a student-facing action in the EU is now a product-killing liability. If EU is on your roadmap, design gaze-and-presence-first from day one.
BIPA (Illinois) and state-level bans
Private schools and EdTech vendors in Illinois need written notice + written consent before collecting facial geometry. 2024’s SB 2979 capped damages at ~$5k per person per violation, but class exposure is still large. New York has banned facial recognition in K–12 entirely; other states are following. Build the consent UX now.
Reach for a DPIA + explicit opt-in flow when: any pixel of learner facial data might be processed in the EU, you use emotion labels anywhere, or your buyer is a regulated public institution (NHS-linked, DoE-linked, or ministry-grade). Cost of retrofitting is 3–5x vs. doing it in the first sprint.
LMS integration — LTI 1.3, xAPI, and the silos problem
72% of institutions are already drowning in fragmented data. A new analytics product that lives in its own dashboard adds to the problem; a product that pushes signals back into the LMS grade book and the student dashboard solves it. Three integration rails matter.
LTI 1.3 Advantage. The launch protocol for embedding your tool inside Canvas, Moodle, Blackboard, D2L, and Open edX. Handles SSO, deep links, and a grade passback channel. This is table stakes for institutional sales — an LMS admin simply won’t install a tool that doesn’t speak LTI.
xAPI / cmi5. The statement vocabulary for “actor did activity with result.” Emit “student watched minute 7–12 with engagement 0.62” statements to a learning record store (LRS), and any downstream reporting tool — institutional BI, learning analytics dashboards, custom coaching tools — can consume them without a bespoke integration.
Webhook/SCORM fallbacks. SCORM 2004 is still the lingua franca of corporate LMSes; a SCORM wrapper gets you into Cornerstone, SumTotal, Docebo. Webhooks cover the Slack/Teams nudge lane and custom institutional automations.
We’ve wired all three patterns into platforms like BrainCert and Scholarly; the data-engineering payoff is that the analytics become operational artefacts of the existing LMS rather than a shadow system nobody opens. Our e-learning video engineering guide walks the LTI, xAPI, and cmi5 mechanics end to end.
Cost model: what an engagement analytics MVP actually costs
We’ll show the shape of the math and flag where we’re confident vs. guessing. Agent Engineering (our AI-augmented delivery practice) compresses the feature-work portion of these numbers; cloud and third-party line items are the same for everyone.
| Component | Scope | Typical range (Fora Soft, AI-augmented) | Notes |
|---|---|---|---|
| On-device vision (MediaPipe + custom classifier) | Web + iOS + Android gaze/pose pipeline | $12k–$22k | 2–3 engineers × 3–4 weeks |
| Backend + event pipeline | Ingest, LRS, at-risk model, alerts | $10k–$18k | Node/Go + Postgres + Redis + a boosting model |
| LTI 1.3 + xAPI integration | Canvas, Moodle, Open edX | $6k–$12k | Per additional LMS: +$2k–$4k |
| Consent + compliance UX | FERPA / GDPR / BIPA flows, DPIA artefacts | $4k–$8k | Design + legal review with your counsel |
| Teacher + admin dashboards | Cohort heatmaps, at-risk queue, drill-down | $6k–$10k | React + charting + API |
| MVP total (LTI-integrated) | 10–14 weeks calendar time | $38k–$65k build + ~$1k–$3k/mo cloud at 20k–100k learner-minutes/mo | Assumes on-device vision; cloud APIs would add $2k–$10k/mo |
The cloud variable cost is the one that swings: 100,000 minutes/month through AWS Rekognition Video’s stored-video analysis at the $0.10/min entry rate is $10,000/mo of pure API fees. Volume tiers pull that toward ~$0.04/min at scale, but it stays an order of magnitude above on-device — and AWS is retiring its cheaper streaming-video-events path to new customers in April 2026, which pushes real-time use cases onto the device anyway. The same workload on MediaPipe on-device is $0 of API fees and roughly $150–$400/mo of backend compute for aggregates. At 1M minutes/month the edge approach pays for its entire build cost in under a quarter.
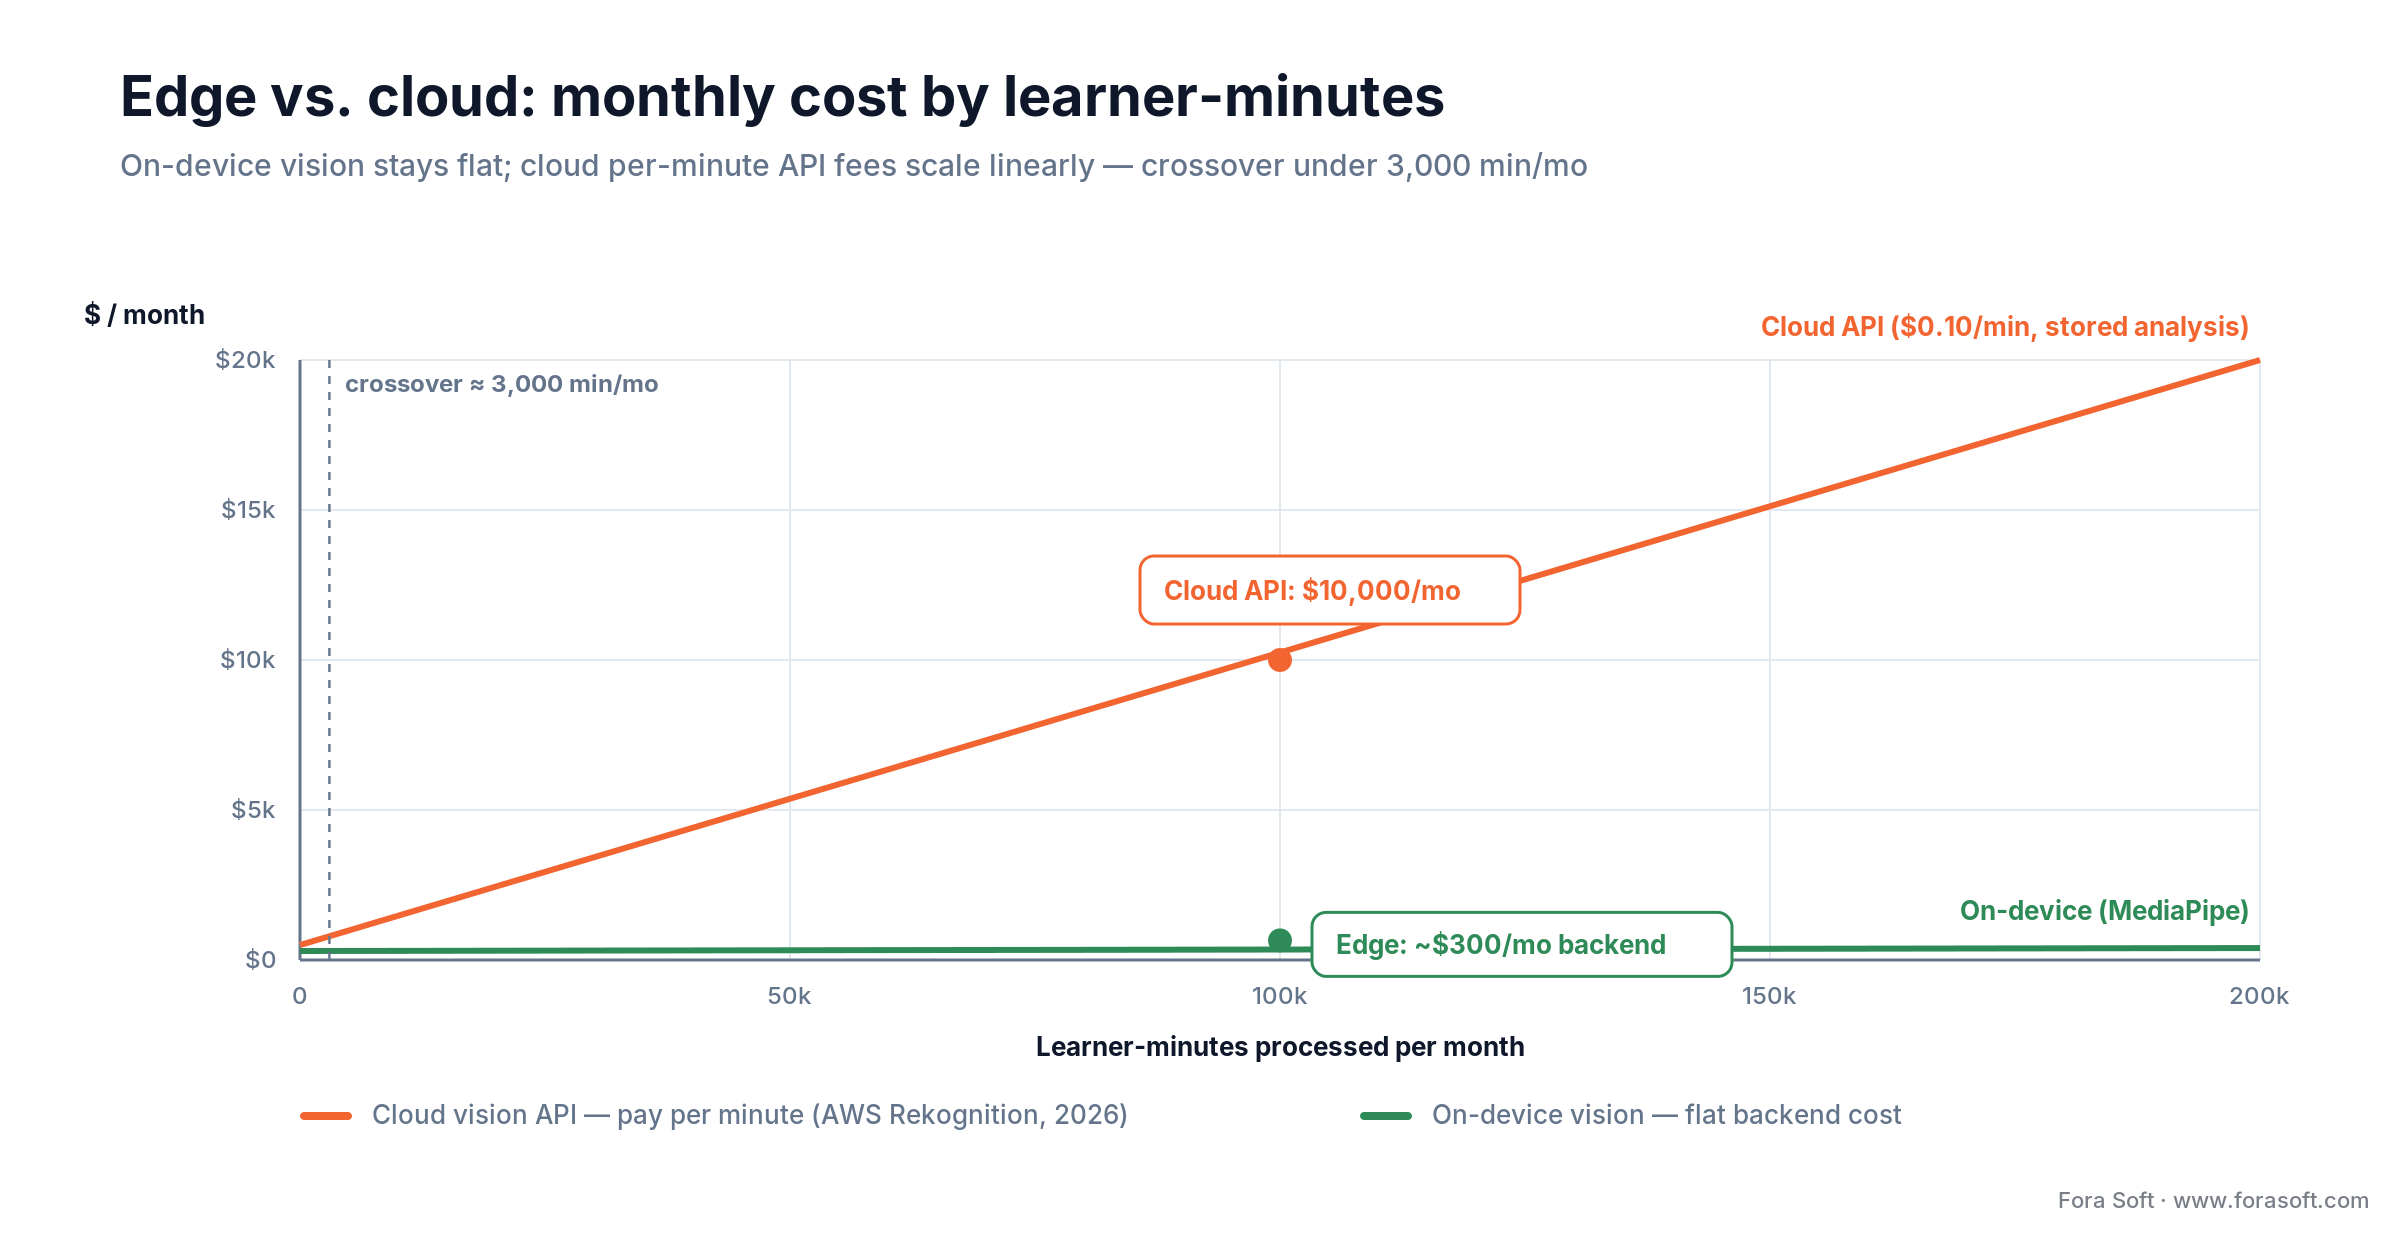
Figure 4. On-device vision stays flat while cloud per-minute fees scale linearly — the crossover arrives under 3,000 learner-minutes per month.
Mini case: Scholarly and a 12-week engagement rollout
Situation. Scholarly runs interactive classes for the Asia-Pacific market — over 15,000 active users, sessions of up to 2,000 concurrent participants, named the most innovative EdTech startup in APAC by AWS. The completion rate across long-form courses was stuck in the classic 12–18% band and institutional buyers were asking for engagement proof before renewing.
12-week plan. Weeks 1–3: ship per-second lecture dwell-time analytics and a cohort heatmap — zero biometric data, fast win for the course design team. Weeks 4–7: layer on-device gaze + head-pose with MediaPipe, emit xAPI statements into the existing LRS, wire an at-risk model into the teacher dashboard. Weeks 8–10: A/B test content rewrites on the lowest-engagement lecture segments. Weeks 11–12: roll out real-time attention nudges to opt-in cohorts, measure outreach conversions.
Outcome shape. The teams saw the same pattern the Georgia State early-alert program documents: course-completion lift correlated directly with how aggressively instructors acted on the at-risk queue, not with the mere existence of the dashboard. Want a similar assessment for your platform? Book a 30-min engagement analytics review.
A decision framework — pick your build in five questions
1. Where are your learners geographically? If any are in the EU, design emotion-free from day one; the EU AI Act doesn’t let you retrofit this. If your footprint is US-only K–12, prioritize FERPA + COPPA; if you’re in Illinois private ed, add BIPA consent flow before launch.
2. How many student-minutes are you processing per month? Under ~20k minutes/month, cloud APIs are fine and move fastest. Above that, the economics and privacy pressure both point to on-device vision. Above 500k/month, on-device is the only sane choice.
3. Which LMSes are your buyers on? Canvas + Open edX? LTI 1.3 and xAPI are table stakes. Enterprise L&D? SCORM 2004 and webhook alerts matter more than LTI. Map before you build.
4. Who acts on the signals? Teachers? Admins? The student themselves? An adaptive system? The whole stack pivots on this — teacher-driven means dashboards + alerts, student-driven means in-app nudges, adaptive means tighter models and stronger compliance. Be honest about the workflow partner.
5. What’s your outcome KPI? Completion? Time-to-mastery? Average quiz score? Something else? The KPI dictates which signals you collect and how you evaluate the model. Teams that skip this question ship pretty dashboards that no one believes.
Need help turning these five questions into a build plan?
We’ll run the five-question audit live on your product in 30 minutes and leave you with a one-page architecture + cost sketch.
Five pitfalls we see over and over
1. Treating attention as a proxy for learning. Attention correlates with some outcomes and not others. Game-based-learning studies have repeatedly found weak or inconsistent correlation between measured attention and test scores. Use attention as a signal for where to look, never as the outcome itself.
2. Deploying emotion models without demographic audit. Public emotion datasets are Caucasian-leaning; accuracy drops 10–25% on non-Western faces and on adults over 40. Deploying at an institution without a demographic accuracy report is both an ethics problem and a reputational bomb waiting to explode.
3. Building dashboards no one reviews. Engagement data only works when someone — instructor, tutor, admin — does something with it. The documented outcome lifts (Georgia State’s 22-point graduation gain, Purdue’s Course Signals retention) come from programs that also changed the teaching workflow. Sell the workflow, not the dashboard.
4. Sending raw frames to the cloud to save engineering time. It feels faster to pipe every frame to Rekognition. It isn’t, at scale — you’ll blow through your budget and your compliance envelope in the same quarter. Push the vision primitives to the device from day one.
5. Using engagement in high-stakes decisions. Never auto-fail, auto-ban, or auto-revoke credentials from engagement scores. Keep a human in the loop for anything that touches a student’s transcript, and document it in your DPIA and your terms of service.
KPIs: what to measure, in three buckets
Quality KPIs. Engagement score validity vs. human labels — target ≥0.75 correlation on a blinded sample. False-positive rate on at-risk alerts below 20%. Demographic accuracy deltas under 8 percentage points between subgroups. Gaze-tracking precision under 3° on mid-range webcams.
Business KPIs. Course completion lift vs. baseline cohort (target +10–30 points over 2 semesters). Time-to-mastery reduction on flagged topics (target 15–25%). Teacher dashboard weekly active rate (target >60% of active instructors). Renewals and RFP win rate — if engagement analytics isn’t showing up in sales calls, it isn’t working.
Reliability KPIs. End-to-end latency from frame to score under 500 ms p95. xAPI statement delivery SLA 99.9%. Zero data-egress incidents — anyone finding a raw facial frame outside the user’s device is an incident, full stop. Cost per 1,000 learner-minutes processed — track it monthly; it’s the early warning of an architectural problem.
When to not build video engagement analytics
Three cases where the honest answer is “don’t.” Under 5,000 monthly learners and no LMS partner. You’ll spend more on compliance setup than the lift can justify; prioritize content-level drop-off analytics (no biometrics needed) instead.
Corporate L&D where learners won’t enable the webcam. Workplace engagement analytics via webcam has its own EU AI Act prohibition and, in most cultures, is a trust-destroyer. Instrument the LMS and video player; leave the camera off.
You don’t have an intervention layer. If your teachers won’t call at-risk students and your product can’t adapt the content, the analytics will sit unused and you’ll own the compliance burden for nothing. Fix the workflow first; add analytics after.
Data architecture: what to store, what to throw away
The difference between a privacy-safe product and a lawsuit is usually a retention policy. Four rules we apply to every engagement analytics system we ship.
Never store raw facial frames. Compute landmarks and scores in memory on the device; discard the frame before the next one arrives. If you need to debug accuracy, capture synthetic test footage in a consented lab session, never from production.
Store only aggregated signals. A minute-level engagement score tied to a session ID is enough for every dashboard and every at-risk model we’ve shipped. Per-frame landmarks and gaze vectors leave the device only as a single number per minute, not as a time series anyone could reverse-engineer.
Separate identity from analytics. Analytics tables reference a study ID, not a student email or SIS key. Link tables exist, live under tighter access control, and are deleted on a faster retention clock than the aggregated analytics themselves.
Retention clocks on everything. Raw lecture dwell: 18 months. Engagement score per student: current term + 90 days. Identity link table: current term only. Automate deletion; don’t rely on human discipline.
Building the at-risk model without overfitting or bias
The at-risk classifier is the highest-impact machine-learning component in the stack, and also the easiest one to overfit. A gradient-boosted model (XGBoost or LightGBM) on a handful of features — engagement score trend, quiz cadence, login gaps, late-submission ratio — will outperform anything deeper until you have tens of thousands of labeled learner outcomes. Start simple.
Feature selection. Use leading indicators that an instructor could verify: declining engagement over the last 3 lectures, quiz scores slipping below cohort median, more than 5 days since last login. Avoid noisy demographic features; they’re rarely predictive and they introduce legal fragility.
Label carefully. “At risk” should mean “left the course without completion within N days” — not “scored below 60%.” Labeling on outcomes instead of grades keeps the model honest and keeps it useful across institutions with different grading philosophies.
Calibration and fairness checks. Run precision-recall curves per subgroup (age band, first-time-student flag, part-time vs. full-time). Publish a monthly fairness report inside the product. If precision for one subgroup is materially lower, reduce alert aggressiveness for that group until you’ve retrained with more data.
Proctoring vs. engagement — keep them in separate boxes
It’s tempting to reuse the same vision stack for exam proctoring and for engagement — same camera, same face detection, same gaze signals. Don’t. They are different products with different compliance and trust profiles, and merging them hurts both.
| Dimension | Engagement analytics | Proctoring |
|---|---|---|
| Purpose | Help the learner | Detect cheating |
| Stakes | Low (nudges, dashboards) | High (invalidated exams, academic integrity cases) |
| Consent model | Opt-in, granular | Required-before-exam, with appeal rights |
| Data retention | Aggregates only, short window | Full session recording, retained per institution policy |
| EU AI Act classification | Limited / minimal risk (if emotion-free) | High-risk system; conformity assessment required |
Practical rule: ship two products with two data stores and two consent flows, even if a handful of the ML primitives are shared under the hood. The minute a lawyer or auditor sees them comingled, you’ll spend weeks explaining why an “engagement score” is sitting next to an “exam integrity flag” for the same student.
Reach for a separate proctoring product when: the stakes include grades, credentials, or certification. Engagement analytics should never be able to invalidate a transcript event — even accidentally — because that’s a high-risk AI use that triggers a different regulatory tier entirely.
FAQ
Is AI emotion recognition in online learning legal?
In the EU, no — inferring emotional state from biometric data in an education institution is prohibited under Article 5 of the EU AI Act (effective Feb 2025). Detecting readily apparent expressions (“is smiling”) is allowed, but not labeling internal emotions. In the US, it’s legal but regulated by FERPA for data protection and, in Illinois, by BIPA for consent. Most production EdTech should skip emotion labels entirely and use gaze-and-presence signals that don’t cross the line.
How much does an engagement analytics MVP cost?
A realistic LTI-integrated MVP — on-device gaze + pose, cohort heatmaps, at-risk alerts, FERPA-ready storage — runs $38k–$65k build with Fora Soft’s AI-augmented delivery, plus $1k–$3k/month of cloud at 20k–100k learner-minutes/month. A pure cloud-API approach costs less to build but substantially more to run, and carries higher compliance risk.
Can I run engagement analytics entirely on the device?
Yes for the vision primitives (face detection, landmarks, gaze, head pose) — MediaPipe and ONNX Runtime handle this at 30 FPS on modern CPUs. Predictive modeling (at-risk classification) needs cross-learner data, so it lives in the cloud but only on aggregated, de-identified signals. The architecture we default to: edge for raw biometric processing, cloud for rollups and predictions.
Does AI video analytics actually raise course completion?
Yes, when paired with teacher intervention. Georgia State University’s early-alert analytics plus adviser outreach raised its six-year graduation rate 22 points (32% to 54%+); Purdue’s Course Signals reported comparable retention gains. Dashboards on their own don’t move the needle — the lift comes from the workflow that acts on flags. Institutions that treat analytics as an operational tool for tutoring and content iteration see the gains; those that treat it as reporting see none.
What’s the difference between engagement tracking and proctoring?
Engagement tracking measures whether a learner is attending to content and uses the signal to help them learn. Proctoring detects cheating during high-stakes exams and uses the signal to flag or invalidate an attempt. They share infrastructure (webcam, face detection, gaze) but have very different compliance profiles: proctoring is a high-stakes decision system under the EU AI Act and typically needs richer consent, human review, and appeal processes. Keep them as separate products with separate data stores.
How do I integrate with Canvas, Moodle, or Open edX?
Use LTI 1.3 Advantage for launch, SSO, and grade passback; emit xAPI or cmi5 statements to the institution’s Learning Record Store so dashboards, BI tools, and downstream coaching platforms see the same events. For older corporate LMSes that still require SCORM 2004, build a wrapper. Canvas and Open edX additionally expose rich REST APIs you can use for cohort sync and roster imports.
Will AI video analytics bias against certain students?
It can, especially if you rely on emotion models trained on non-representative datasets. Accuracy drops 10–25% on older adults and on non-Western faces in off-the-shelf models. Mitigate with a demographic audit before launch, retraining on institution-specific data, monitoring accuracy deltas across subgroups quarterly, and never using the signal in high-stakes decisions without human review. Better still, avoid emotion models altogether and stick with gaze/pose, which have less demographic bias.
How long does a pilot typically take?
A useful pilot runs 10–14 weeks end-to-end: weeks 1–3 for content-level analytics, weeks 4–7 for on-device vision + LTI/xAPI wiring, weeks 8–10 for the at-risk model and teacher dashboard, weeks 11–14 for A/B tests and compliance artefacts. With Agent Engineering in the mix, we run several of these stages in parallel and usually land toward the lower bound of the range.
What to Read Next
Case study
Scholarly: a 15,000-user all-in-one LMS
How we shipped WebRTC classes, microservices, and analytics for a 15,000-user platform.
Tutoring
Intelligent Tutoring Systems: 2026 Playbook
How adaptive content pacing and AI tutors pair with engagement analytics.
E-learning
AI for E-Learning Video Tools
Cost-cutting AI features for EdTech video platforms, with a stack-by-stack cost model.
Engagement
AI-Powered User Engagement: 3-Layer Playbook
Personalization, nudges, and real-time analytics across the engagement stack.
Recommendation
Content Recommendation Platforms for eLearning
Top recommendation platforms that keep learners moving through your catalog.
Ready to ship engagement analytics that actually moves completion?
The short version: AI video analytics in online learning works, but only when you design for behavior signals instead of inferred emotion, run the vision on the device, feed the LMS instead of a standalone dashboard, and pair every signal with a human or adaptive workflow that actually acts on it. Do that, and Georgia-State-class outcome lifts are reachable without betting the product on an ethically shaky emotion model.
Fora Soft has been shipping this exact stack since before it was called “AI video analytics” — virtual classrooms, interactive lecture platforms, and AI-first coaching tools from Career Point to BrainCert and Scholarly. If your team is trying to decide where to start, we can compress the first 12 weeks into a concrete plan and a working prototype on your own data.
Bring your course and your numbers — leave with a plan
30 minutes with a senior EdTech architect. We’ll map your engagement analytics stack, flag the compliance gotchas, and sketch a 12-week rollout you can hand to your board.


