


Why this matters
The bitrate ladder is the single biggest lever you have on streaming cost, perceived quality, and start-up time. A bad ladder pays the egress bill three times: in pixels nobody can see, in rebuffers from rungs that are too sparse, and in encoder hours spent on renditions nobody picks. Product, finance, and engineering all meet the ladder through three signals — bandwidth cost per viewer, complaints about quality, and time-to-first-frame — but most teams build their first ladder by copy-pasting Apple's reference table and never revisiting it. This calculator gives any team a content-aware starting point in under a minute, and the article below explains every rule the calculator applies so you can defend the numbers to your CTO.
How a bitrate ladder works, in one paragraph
A bitrate ladder is a list of pre-encoded versions of the same video, each at a different combination of resolution and bitrate. The list lives inside the manifest — the small text file the player downloads first. For HTTP Live Streaming, abbreviated HLS, the manifest is a multi-variant playlist with the extension .m3u8; the controlling document is Internet Engineering Task Force standard RFC 8216, §4.3.4.2. For Dynamic Adaptive Streaming over HTTP, abbreviated DASH, the manifest is the Media Presentation Description with the extension .mpd; the controlling document is ISO/IEC 23009-1:2022. Each entry in either manifest is a rung, and each rung carries a bitrate, a resolution, a codec, a frame rate, and an audio variant association. The player picks one rung at a time and switches as the network changes. That is the whole shape; everything below is about how to choose the numbers.
Use the calculator. The rest of this article explains why it gives you the answers it does.

Figure 1. The ladder is the menu. The encoder builds it once; the packager publishes it; every player picks rungs from the same list according to its own measured network.
The five rules every bitrate ladder must respect
The calculator encodes five rules. Three of them survive from Apple's 2014 fixed-ladder thinking; two come from Netflix's 2015 per-title work and the 2026 multi-codec consensus.
Rule 1 — Geometric spacing, not equal spacing
Adjacent rungs are spaced by a multiplicative factor, not by an additive step. A jump from 400 kbps to 600 kbps is a 50% increase a viewer can see; a jump from 4,000 kbps to 4,200 kbps is a 5% step that mostly wastes encoder time. The widely-used target ratio is between 1.4× and 1.7× between adjacent rungs. Apple's reference ladder in §2.7 of the HLS Authoring Specification (revision 2025-09) sits at roughly 1.5× between most steps, with two tight pairs near 1080p where the platform wants extra resolution to switch between under load.
The math is two lines:
ratio = adjacent_bitrate_high / adjacent_bitrate_low
1.4 ≤ ratio ≤ 1.7   for adjacent rungs
This calculator uses logarithmic interpolation between the top rung's base bitrate and the lowest rung's base bitrate to pick intermediate resolutions whose base bitrates fall close to the target geometric points. The result is a ladder that descends smoothly enough for adaptive bitrate algorithms to switch one rung at a time without jolting the viewer.
Rule 2 — Resolution moves with bitrate
A 400 kbps stream at 1920×1080 looks worse than a 400 kbps stream at 640×360, because the encoder is asked to spread its bit budget over too many pixels. There is a "knee" above which adding pixels stops adding visible quality at a given bitrate. The classic fix is to cluster two or three rungs at the top resolution, then drop resolution at the bottom — at 540p, 432p, 360p, and below.
This calculator respects that knee. It never gives you a top rung at the source resolution and a near-floor rung at the same resolution — those rungs would compress to the same picture quality, wasting one slot.
Rule 3 — Codec efficiency is multiplicative
H.264, abbreviated AVC, is the universal floor — every device made since 2008 can decode it. But for the same picture quality, HEVC (H.265) ships at roughly 55% of H.264's bitrate, AV1 at roughly 42%, and VP9 at roughly 65%. The numbers vary by content type and by encoder preset, but the Bitmovin 2026 codec study and the Netflix BD-rate work published 2024–2025 converge on those ratios for production presets.
The calculator multiplies the H.264 base bitrate by the codec efficiency factor:
codec_efficiency_h264 = 1.00
codec_efficiency_hevc = 0.55
codec_efficiency_av1  = 0.42
codec_efficiency_vp9  = 0.65

bitrate(codec) = bitrate(h264_reference) × codec_efficiency(codec)
A 1080p H.264 top rung at 5,000 kbps becomes a 1080p AV1 top rung at roughly 2,100 kbps with comparable VMAF — the perceptual quality metric Netflix open-sourced in 2015 and the industry adopted as the consensus visual-quality measure.
Rule 4 — Content complexity scales the whole ladder
A static cartoon and a fast-action sports broadcast both look acceptable at 2,000 kbps with completely different settings. The cartoon barely needs 1,000 kbps; the sports stream needs 3,500 kbps to avoid blocking. Netflix's 2015 Per-Title Encode Optimization paper made this the industry's foundational insight: build a ladder per title, not per platform. The 2018 Dynamic Optimizer paper extended that to a per-shot level, cutting another 10–15% bandwidth at the same VMAF.
The calculator approximates that work with a content-complexity multiplier:
Content classMultiplierExamplesEasy0.70×Animation, slideshow lectures, talking-head, low-motion screencastsStandard1.00×Drama, news, documentary, mid-motion VODHard1.25×Sports, action, esports, music with strobe lightingExtreme1.45×4K HDR sports, dense particle motion, premium concert film
This is a shortcut, not a substitute for a real convex-hull search across your own content. For a high-traffic VOD service, the 2026 production state of the art is still Mux's Halfpipe model or Bitmovin's per-title encoder, which runs a neural net over the actual frames and emits a content-specific ladder in milliseconds. Use the calculator to size your ladder; use a per-title encoder to ship it.
Rule 5 — Frame rate and dynamic range have their own costs
Sixty frames per second roughly doubles the encoder's work compared to thirty. The bitrate per rung does not double — modern encoders compress temporal redundancy well — but it lifts by a factor of about 1.4×. The exact number depends on encoder preset and content; the calculator applies 1.4× for 60 fps and 1.35× for 50 fps.
High dynamic range adds another premium. HDR10 (10-bit, BT.2020 colour, PQ transfer) lifts bitrate by about 15% on the top two rungs, where bright highlights and dark shadows need the extra precision; Dolby Vision adds about 20%. The calculator only applies the HDR multiplier on the top two rungs because the lower rungs are too compressed for the HDR difference to be visible.
How the calculator builds your ladder, step by step
The algorithm runs four passes per recompute. Each pass is small enough to do by hand on a piece of paper, which is why the calculator stays predictable instead of becoming a black box.
Pass 1 — Pick the resolution set. The calculator filters its internal table of reference resolutions to those at or below your source. A 1080p source returns the subset {1080p, 720p, 540p, 432p, 360p, 270p, 234p}; a 4K source extends the same table up.
Pass 2 — Choose the number of rungs. VOD ships 9 by default; live with low-latency ships 6; real-time WebRTC ships 4; user-generated content ships 4. These numbers come from the 2025 Bitmovin Video Developer Report (167 developers, 34 countries), which lists the median rung count per workflow. The calculator then picks rungs from the resolution set so that adjacent base bitrates fall close to a geometric progression between the top and bottom rungs.
Pass 3 — Apply the multipliers. Each chosen rung's base bitrate is multiplied by codec efficiency, content complexity, frame-rate factor, and (for the top two rungs) the HDR factor. The result is rounded to the nearest 25 kbps so the manifest reads cleanly.
Pass 4 — Reshape for the audience profile. A mobile-dominant audience pushes the calculator to lift the bottom two rungs by 10% — cellular networks need a stronger floor — and to cap the top rung at 1080p. A broadband-only audience drops the bottom two rungs entirely. A living-room over-the-top audience pushes the ladder top-heavy because TVs pin to the highest available rung.
The result lands in a sortable table with seven columns: rung index, resolution, video kbps, total kbps (video plus audio), frame rate, codec string, and a one-line use hint.
A worked example: 1080p VOD drama on a global audience
Pick a typical mid-tier streaming service. The codec is H.264 (you still need the universal fallback), the source is 1080p, the frame rate is 30, the content is "standard" drama, the workflow is VOD, the audience is global, the dynamic range is standard, the audio is 128 kbps stereo AAC.
Plug those into the calculator. It returns nine rungs.
RungResolutionVideo kbpsTotal kbpsUse11080p (1920×1080)5,0005,128Top — fibre21080p (1920×1080)3,2003,328Main 1080p3720p (1280×720)2,4002,528Good Wi-Fi4720p (1280×720)1,5001,628Wi-Fi5540p (960×540)1,4001,5284G LTE6432p (768×432)7258534G cell7360p (640×360)4505783G / 4G floor8270p (480×270)275403Slow cellular9234p (416×234)175303Mobile fallback
The adjacent ratios fall between 1.4× and 1.6× (5,000 / 3,200 = 1.56; 3,200 / 2,400 = 1.33; 2,400 / 1,500 = 1.60; 1,500 / 1,400 = 1.07; 1,400 / 725 = 1.93; …). The 1.07× and 1.93× gaps point at the two places the calculator deviates from a strict geometric progression — at the resolution change between 720p and 540p, where two rungs sit at 720p so the player can switch between them under load, and at the 540p → 432p step where the calculator drops one rung to keep the ladder short enough.
Now switch the codec to AV1, the content to "hard" (action sports), and the dynamic range to HDR10. The top rung lands at about 3,000 kbps for 1080p — a 40% drop from the H.264 number, even with the sports multiplier and the HDR premium. That is the production economic argument for AV1 in one row of a table.
The math of the egress bill
The calculator's summary panel shows you the egress cost for one viewer-hour at the top rung. The arithmetic:
top_rung_total_kbps = 5,128
bytes_per_second    = 5,128 × 1000 / 8 = 641,000
bytes_per_hour      = 641,000 × 3600   = 2.31 × 10⁹
gigabytes_per_hour  = 2.31 × 10⁹ / (1024 × 1024 × 1024) = 2.15 GB
cost_per_hour       = 2.15 × $0.008    = $0.017
A platform with one million daily active viewers averaging ninety minutes a day, half on the top rung, pays roughly:
1,000,000 × 90/60 × 0.5 × $0.017 = $12,750 per day = $4.65 million per year
That is one rung of one ladder for one codec. Multiply by two codecs (H.264 + HEVC, or H.264 + AV1), and the bandwidth bill is real money. The calculator's reference rate of $0.008 per gigabyte is a 2026 mid-tier commit price; high-volume customers pay $0.003–$0.005, and short-tail customers pay $0.020+. Substitute your own number.
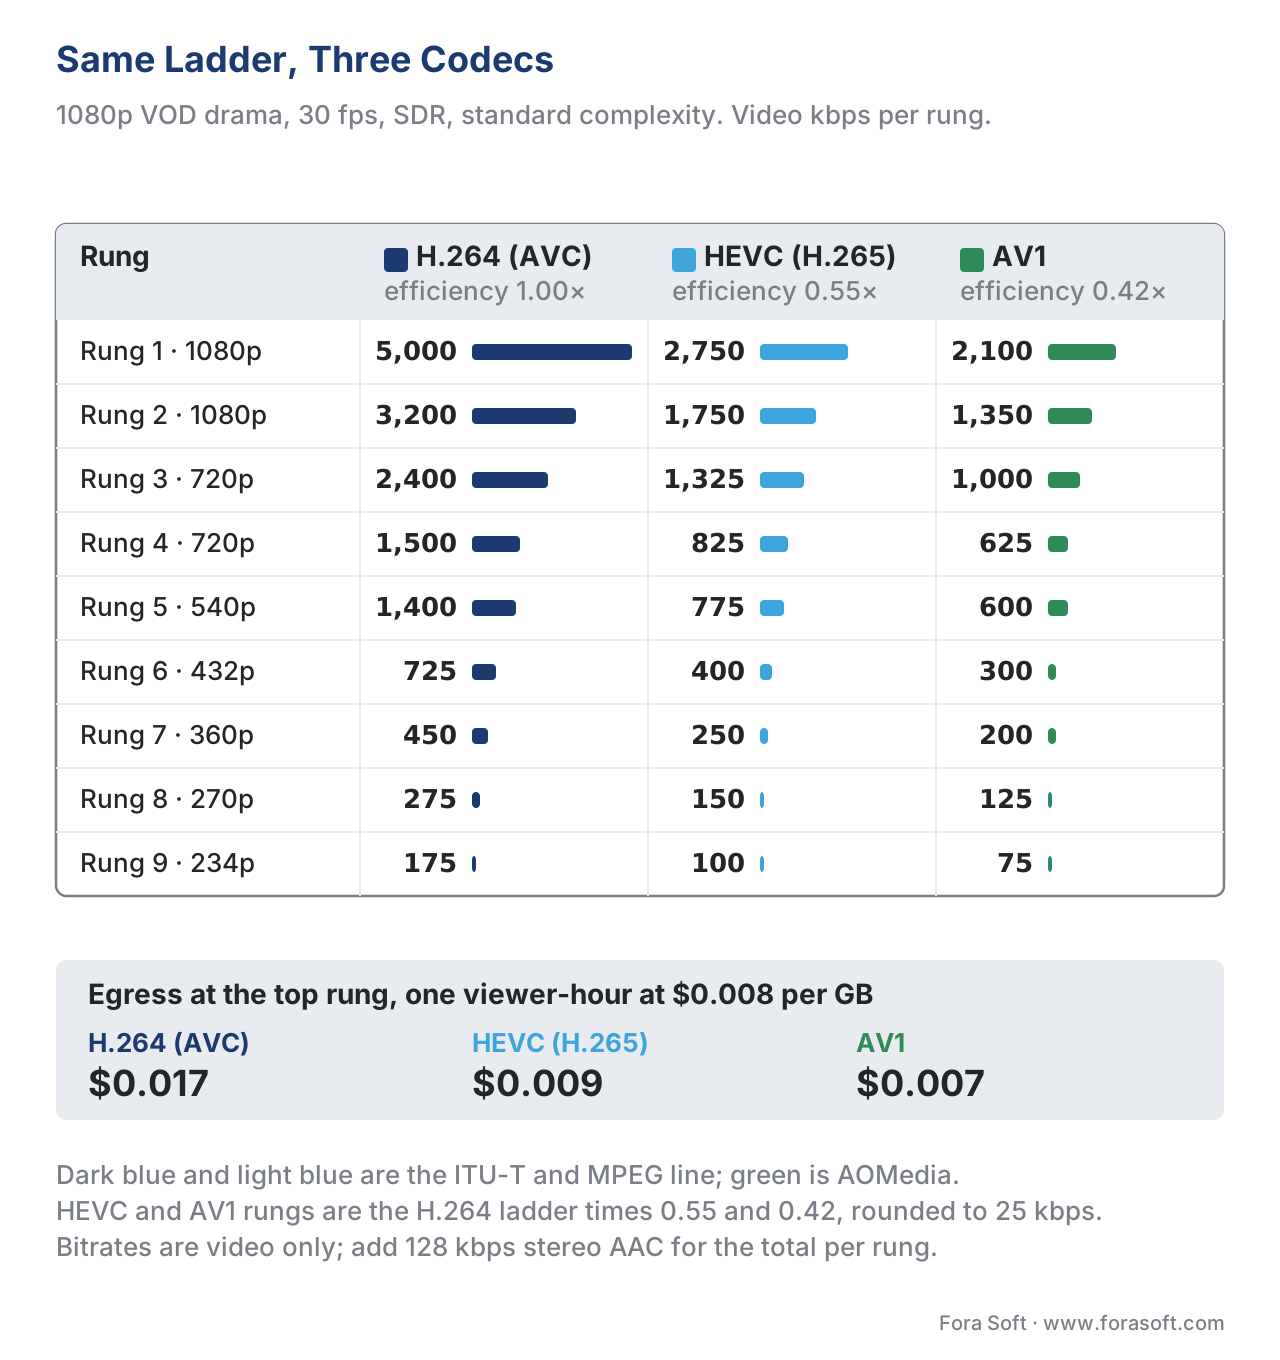
Figure 2. The same 1080p VOD ladder, three codecs. The top rung is the headline number; the catalogue bill is the area under each curve.
The outputs you can paste into production
The calculator emits four downloadable artefacts per recompute.
HLS multi-variant playlist. A complete .m3u8 with one #EXT-X-STREAM-INF line per rung, the right RESOLUTION, BANDWIDTH, AVERAGE-BANDWIDTH, FRAME-RATE, and CODECS attributes, and a single audio rendition group. Paste it into your origin's manifest path, and a stock player picks it up. The format follows RFC 8216, §4.3.4.2.
DASH MPD skeleton. A bare <MPD> with one <AdaptationSet> for video, one for audio, and one <Representation> per rung. Format follows ISO/IEC 23009-1:2022. You still need to fill in your SegmentTemplate paths; the skeleton is the rendition declarations only.
FFmpeg command per rung. A copy-pasteable command for each rung that runs the right encoder (libx264, libx265, libsvtav1, libvpx-vp9), the right scale filter, the right keyframe interval (2 × fps, the production default for HLS and DASH), and the right buffer sizes. Use it for one-off encodes; for catalogue work, drive the same parameters through your transcoding cluster (AWS MediaConvert, Mux, Bitmovin, or your in-house pipeline).
JSON dump. The whole ladder, plus your input parameters and a timestamp, as a single JSON object. Useful for piping into a config-as-code workflow or for auditing what a stakeholder used at decision time.
The HLS playlist and DASH MPD are both browser-downloadable from the calculator panel; the JSON works for any automation pipeline.
A common pitfall: trusting the calculator over your own VMAF run
This calculator is a strong starting point, not a substitute for measuring quality against your own content. The codec efficiency multipliers — 0.55, 0.42, 0.65 — are industry averages on production presets, and they will be wrong for your titles by ±10% in either direction depending on encoder version, preset, content mix, and source quality. If a 5% mistake on the top rung costs your platform $200,000 a year, run a VMAF measurement on twenty representative titles before you ship.
The 2025 Mux Halfpipe paper makes this point explicitly: a single static ladder, even a content-aware one built by a calculator, leaves 5–15% bandwidth on the table compared to a real per-title encode that scores VMAF against the actual frames. Use this calculator to size your ladder. Use a per-title encoder to ship it.
Free download: Bitrate Ladder Quick ReferenceOne printable page for the next ladder review: the five rules, the codec efficiency multipliers (HEVC 0.55, AV1 0.42, VP9 0.65), the content-complexity multipliers from 0.70 to 1.45, the frame-rate and HDR premiums, and the rung count each workflow ships — 9 for VOD, 6 for low-latency live, 4 for WebRTC and user-generated content.Where Fora Soft fits in
Fora Soft has built video streaming, OTT, conferencing, e-learning, telemedicine, surveillance, and live commerce platforms since 2005. Every one of those workloads ships a bitrate ladder, and every one of them benefits from a ladder shaped to its content, not borrowed from another platform's docs. We use this calculator at the scoping stage to set first-encode parameters with a client, then move to per-title encoding once the platform's content profile is stable. The decision points are the same on every project: how many rungs the audience profile actually needs, which codec to add second, and where the per-title work pays back its encoder cost. Our video streaming software development team takes the ladder from this first estimate to production HLS and DASH, and for OTT and Internet TV platforms we tune it per device, from phones to Smart TVs.
The book
Video Streaming: A Complete Guide to Video Delivery: From ABR and CDNs to Players, WebRTC, DRM, and the Economics of Streaming
We wrote a seven-volume handbook that takes the whole video stack apart, from the pixel to production, so that someone who works through it can design and build a system like the one this calculator sizes. Volume 3 is where the ladder lives: geometric spacing and the per-title convex hull, what the codec multipliers do to a catalogue, how the CDN bill moves when you retire a top rung, and the player instrumentation that tells you which rungs viewers actually reach. Volume 2 covers the transport and packaging the ladder ships inside — HLS, DASH and CMAF. Written by Nikolay Sapunov, CEO at Fora Soft.
Want to know what your ladder is costing you?
Send us the rung list you encode today, a week of player QoE data, and your CDN rate card. We will tell you which rungs nobody reaches, what a second codec would take off the bill, and whether per-title encoding pays back its encoder cost on your catalogue. 250+ video products shipped since 2005.
See our case studies
Case study
Worldcast Live
Ticketed HD concerts at 1.5 Gb/s and 0.4–0.5 s glass-to-glass for 10,000 simultaneous viewers. Live buys a 6-rung ladder, not a 9-rung one, and every rung has to be one the audience can hold on a 3–6 s buffer.
Case study
Speed.Space
Remote production at 1080p and 8 Mbps for Netflix, Electronic Arts and HBO. When the top rung is written into the contract, the ladder below it exists to keep the session alive, and the content multiplier decides how tall it gets.
Case study
Sprii
72,000+ live shopping broadcasts on web, iOS and Android. A mobile-dominant audience is exactly the profile that lifts the bottom two rungs by 10% and caps the top rung at 1080p.
What to read next
Encoding
Building a Bitrate Ladder: Classic Netflix Ladder, Per-Title, Per-Shot
What the calculator approximates with one multiplier, a convex-hull search does with your own frames.
ABR
Adaptive Bitrate Streaming Explained Without Buzzwords
How the player walks the ladder you just built, and why rung spacing decides what it feels like.
Economics
CDN Cost Economics: 95th-Percentile, Commit, Overage, Transit
Where the $0.008 per GB in the worked example comes from, and how to move it.
Protocols
HLS in Depth: m3u8, Segments, Multi-Variant Playlists
The multi-variant playlist the calculator emits, attribute by attribute.
References
- Apple Inc. — HLS Authoring Specification for Apple Devices, revision 2025-09. Base ladder (§2.7); codec/profile recommendations (§1); HEVC-specific (§1.7). https://developer.apple.com/documentation/http-live-streaming/hls-authoring-specification-for-apple-devices
- IETF — RFC 8216: HTTP Live Streaming (2017-08). Multi-variant playlist format (§4.3.4.2); rendition group definitions (§4.3.4.1). https://www.rfc-editor.org/rfc/rfc8216
- ISO/IEC — ISO/IEC 23009-1:2022 — Dynamic Adaptive Streaming over HTTP (DASH), Part 1, 5th edition. MPD schema and Representation element used in DASH skeleton output. https://www.iso.org/standard/83314.html
- Netflix Technology Blog — Per-Title Encode Optimization (2015-12-14). 20% bandwidth savings at matched VMAF from per-title encoding; convex-hull methodology. https://netflixtechblog.com/per-title-encode-optimization-7e99442b62a2
- Netflix Technology Blog — Dynamic Optimizer — A Perceptual Video Encoding Optimization Framework (2018-03). 10–15% additional bandwidth savings from per-shot encoding on top of per-title. https://netflixtechblog.com/dynamic-optimizer-a-perceptual-video-encoding-optimization-framework-e19f1e3a277f
- ACM Transactions on Multimedia Computing, Communications, and Applications — Convex Hull Prediction Methods for Bitrate Ladder Construction: Design, Evaluation, and Comparison (2025). Survey of convex-hull methods for ladder construction; benchmarking methodology. https://dl.acm.org/doi/10.1145/3723006
- Mux — Instant Per-Title Encoding (Halfpipe) (2025-12). Neural-network-based ladder generation; production-grade per-title in milliseconds. https://www.mux.com/blog/instant-per-title-encoding
- Bitmovin — Video Developer Report 2025 (2025). 167 developers across 34 countries; median rung counts per workflow; multi-codec adoption. https://bitmovin.com/video-developer-report-2025
- DASH Industry Forum — DASH-IF Interoperability Guidelines v5 (2024-2025). Representation construction; bandwidth attribute semantics; switching set conventions. https://dashif.org/guidelines/
- Streaming Learning Center — Comparing H.264, HEVC, VP9, and AV1 in SBE: From BD-Rate to Contextual ROI (2026). Codec efficiency multipliers (HEVC 55%, AV1 42%, VP9 65%) on production presets. https://streaminglearningcenter.com/articles/comparing-h-264-hevc-vp9-and-av1-in-sbe-from-bd-rate-to-contextual-roi.html
- AOMedia — AV1 Bitstream and Decoding Process Specification, version 1.0.0 errata 1 (2019). AV1 codec string format `av01.*` used in HLS multi-variant playlist output. https://aomediacodec.github.io/av1-spec/
- Netflix (GitHub) — Video Multi-Method Assessment Fusion (VMAF). Perceptual quality metric used as the consensus benchmark for ladder construction. https://github.com/Netflix/vmaf
