


Why This Matters
If you run a streaming product — live, on-demand, or both — observability is the difference between a team that ships improvements every week and a team that ships emergency patches every week. The player is where the viewer's experience is actually produced; everything upstream of it — the encoder, the packager, the origin, the CDN, the manifest — is a contribution to that experience, but the experience is rendered in the player and the metrics that prove the experience is good or bad can only be measured at the player. A CDN's edge log knows that a segment was delivered with a 200 status in 180 milliseconds; it does not know that the player rebuffered for three seconds before that segment arrived because the previous segment was 1.4 megabytes when the player's buffer needed it in 1.2 seconds. That arithmetic — the relationship between what the network produced and what the viewer experienced — exists only inside the player, and the only way you ever see it is if the player is instrumented to emit it. This article gives you the schema, the events, the transport, and the decision tree to put that instrumentation in place. It is the player-side observability layer; the related articles 9.9 (the QoE metrics every dashboard should show) and 9.10 (the comparison of Mux Data, Conviva, Bitmovin Analytics, Datazoom, and NPAW) cover what to do with the data once it lands. This article is about producing the data in the first place.
What Player Observability Is, in One Paragraph
Observability is the property of a system that lets an outside observer reconstruct its internal state from the data the system emits. For a streaming player, that means: every event the player undergoes during a playback session — start, segment fetch, ABR switch, buffer drain, error, seek, pause, resume, end — must be turned into a structured record, that record must be sent off the device to a place that can store and query it, and the records from millions of concurrent sessions must be aggregated into numbers that a human can read on a dashboard and a machine can fire an alert from. Three pieces, in order: a schema of what to emit, a transport for getting it off the device, and a storage-and-query layer that turns single records into population statistics. The player is responsible for the first two; the third is what your analytics vendor or your in-house data team builds.
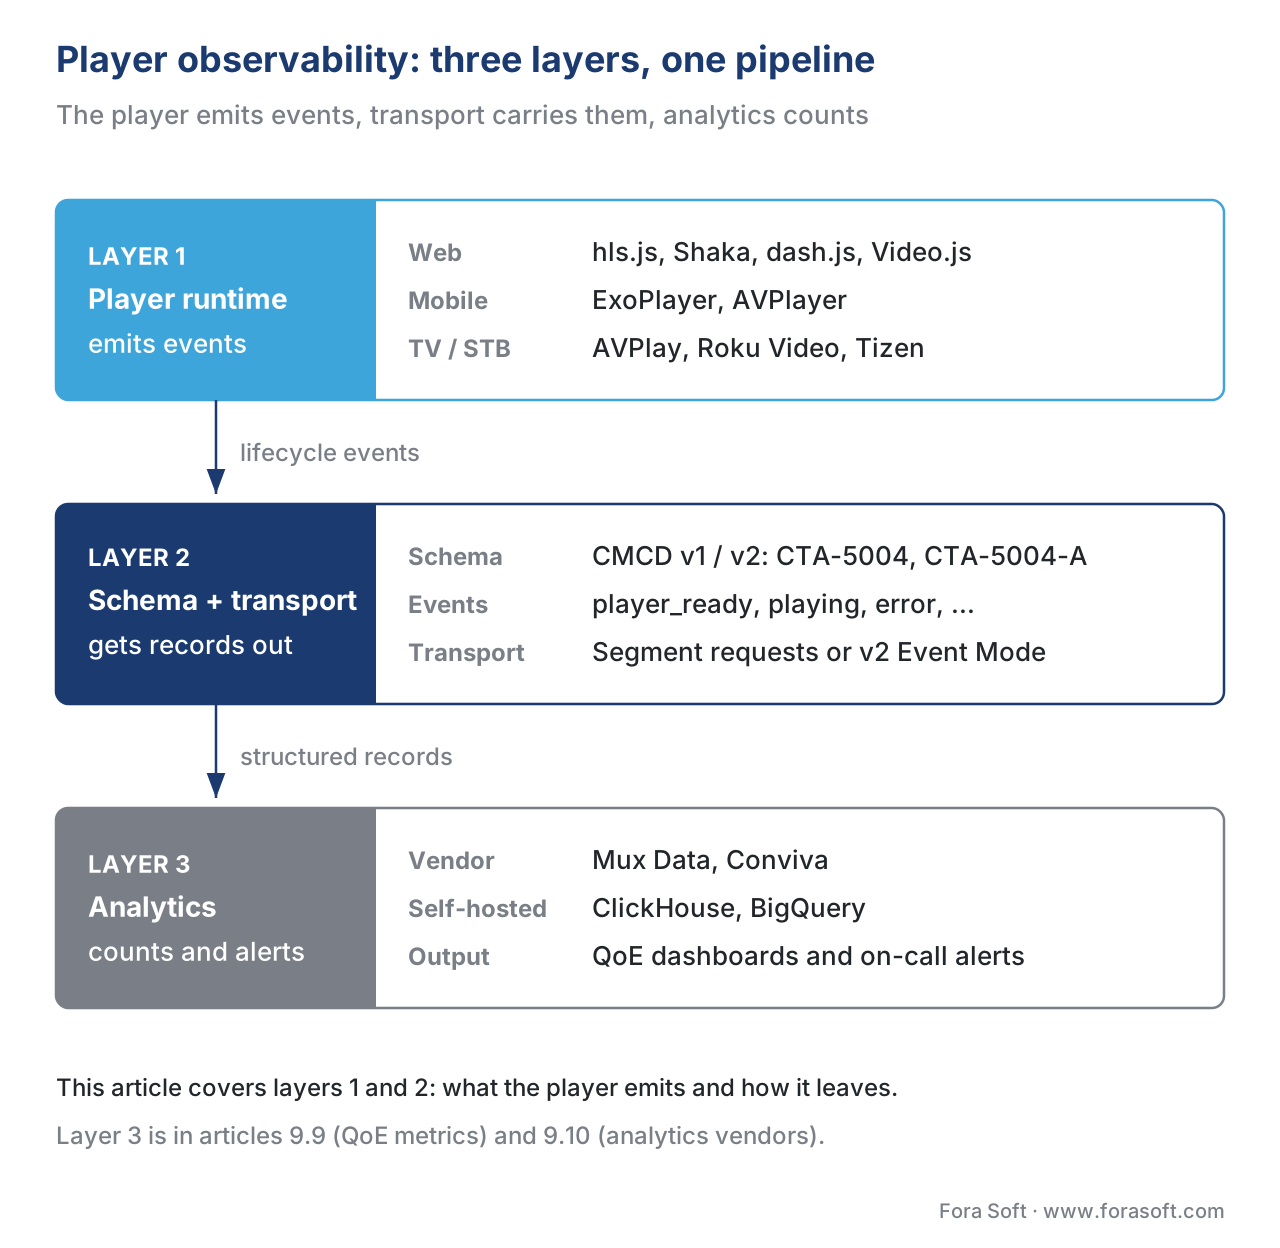 Figure 1. Player observability sits between the player runtime and the dashboard layer. The player emits events; a schema and transport layer turns those events into structured records; an analytics backend turns records into the numbers a human reads. This article covers the two leftmost columns. Articles 9.9 and 9.10 cover the rightmost column.
The deliberate scope of this article is the two leftmost columns of that picture — the events and the transport. The metrics every dashboard should show (rebuffer ratio, exits before video start, video start failures, the rest of the canonical QoE family) are the subject of article 9.9; the comparison of the analytics platforms that ingest these records (Mux Data, Conviva, Bitmovin Analytics, Datazoom, NPAW) is the subject of article 9.10. Here we focus on the side of the system you build into the player.
The Twelve Metrics Every Production Player Must Emit
A production player emits dozens of fields, but twelve of them carry the load. Cut any of these and your dashboards are blind to a real production failure mode. The set comes from three places — the Mux Data metric catalogue, Conviva's Streaming Performance Index, and the canonical QoE literature (Dobrian et al. 2011; Mok et al. 2011) — and the three converge on the same short list because the underlying physics of buffered playback is the same everywhere.
The list, grouped by what it tells you:
Startup metrics — was the viewer able to begin watching?
Video startup time, sometimes written as VST, is the elapsed wall-clock time from the moment the viewer's intent to play is registered (the play button click; the autoplay attempt; the deep-link arrival) until the first frame of video is rendered on screen. Mux measures it from the construction of the player object until the first playing event fires; Conviva calls the same number Video Startup Time and adds a separate "Started Plays" denominator (Mux Data, Understand Mux Data metric definitions, 2026; Conviva, OTT 101: Top 5 Metrics that Matter for Tech Ops, 2024). The unit is milliseconds; an industry target band for video-on-demand is under 2,500 ms at the 50th percentile and under 5,000 ms at the 95th.
Exits before video start (EBVS) is the percentage of play attempts where the viewer abandoned before any video frame was rendered. The viewer hit play, waited some interval, decided the wait was unacceptable, and closed the tab or hit back. Conviva codified this metric and reports it as a first-class number in its SPI score (Conviva, Streaming Performance Index, 2024). Unit: percent.
Video start failures (VSF) is the percentage of play attempts that ended in an error before any video frame was rendered. The viewer hit play, the player tried to load the stream, the load failed with a player error or a DRM rejection or a 404 on the manifest, and no frame ever appeared. Two failure flavours matter — VSF-T (technical, the player threw an error) and VSF-B (business, the viewer was blocked by entitlement or geofencing). Unit: percent of play attempts.
Playback quality metrics — was the picture watchable while it played?
Rebuffer ratio, also called rebuffer percentage, is the fraction of intended-watch time the viewer spent watching the spinner instead of the picture. Numerator: total seconds in a buffering state during the session. Denominator: total intended watch time (some vendors use elapsed wall-clock; Mux and Conviva use the sum of playing and rebuffering time, excluding seek and pause time). A 5% rebuffer ratio means the viewer waited 3 seconds for every 60 seconds of watching. Industry target bands: below 0.5% for high-quality video-on-demand, below 2% for live sport with reasonable conditions. The arithmetic, shown out loud:
rebuffer_ratio = rebuffer_seconds / (playing_seconds + rebuffer_seconds)
              = 3 / (60 + 3)
              = 0.0476
              ≈ 4.8%
Rebuffer frequency is rebuffer events per minute of playback. A frequency of 0.5/min means one rebuffer event for every two minutes of playback. Two sessions with the same rebuffer ratio can have very different frequencies: one long stall versus many short ones. Both numbers matter because viewers tolerate them differently — a single 4-second stall is less annoying than ten 0.4-second stalls totalling the same time.
Average video bitrate is the average encoded bitrate of the renditions actually played, weighted by playing time. Unit: kbps. This metric tells you whether your ABR algorithm is climbing the ladder at all; if the average bitrate is pinned at the bottom rendition while your top rendition sits unused, the ABR has decided your viewers cannot reach it and you have a network or encoder problem upstream.
Upscale / downscale percentage is the share of playing time where the rendered video resolution was lower than the device's display resolution. If your top rendition is 1080p and 30% of viewing time is spent upscaling that 1080p to a 4K display, you know a 4K rendition would have buyers.
Error metrics — when it failed, why?
Playback failure rate is the percentage of started plays — the viewer saw at least one frame — that ended in an error before the natural end of the stream. Unit: percent. Conviva calls the equivalent metric VPF (Video Playback Failure) (Conviva, OTT 101: Your Guide to Streaming Metrics that Matter, 2024).
Error code distribution is the histogram of player error codes emitted during a session. Every error must carry a stable, documented code — not a free-text message — and the histogram of codes against time is the first chart you look at when an alert fires. The CMCD v2 specification standardised this in February 2026 by adding native error-code reporting to the on-wire format (Einbliq.io, CMCD v2 is officially released, February 2026); before v2, every analytics vendor used its own taxonomy and cross-vendor comparisons were impossible.
Network and ABR metrics — what shape was the network in?
Measured throughput is the bandwidth the player's ABR algorithm currently believes it has, in kbps. This is the input to the ABR's next switching decision and the headline number for diagnosing a network-bound session. CMCD v1 standardised the field as mtp and required rounding to the nearest 100 kbps (CTA-5004, §3.3, September 2020).
Buffer level is the playable seconds of media currently sitting in the player's source buffer. The headline metric for diagnosing whether a stall is imminent: a buffer level falling toward zero is a stall about to happen.
Session metrics — who watched, on what, for how long?
Session ID is the GUID that ties every record from one playback session together. The CTA-5004 specification recommends a UUID for the value and that the player attach it to every media request, including manifests, init files, captions, and DRM key requests (CTA-5004, §3.3, September 2020). Without a session ID you cannot follow one viewer's experience through a CDN log; with it, the entire session reconstructs from any of the per-segment records.
Concurrent plays is the count of currently active playback sessions, sampled at one-second granularity. The denominator your dashboards divide everything else by.
That is the twelve. There are dozens of supporting fields — device model, OS version, app version, player version, geolocation, ISP, page URL, content ID, CDN host per segment, codec, DRM scheme — that you need for slicing the data, but the twelve above are the metrics. The supporting fields are dimensions over which you compute the metrics.
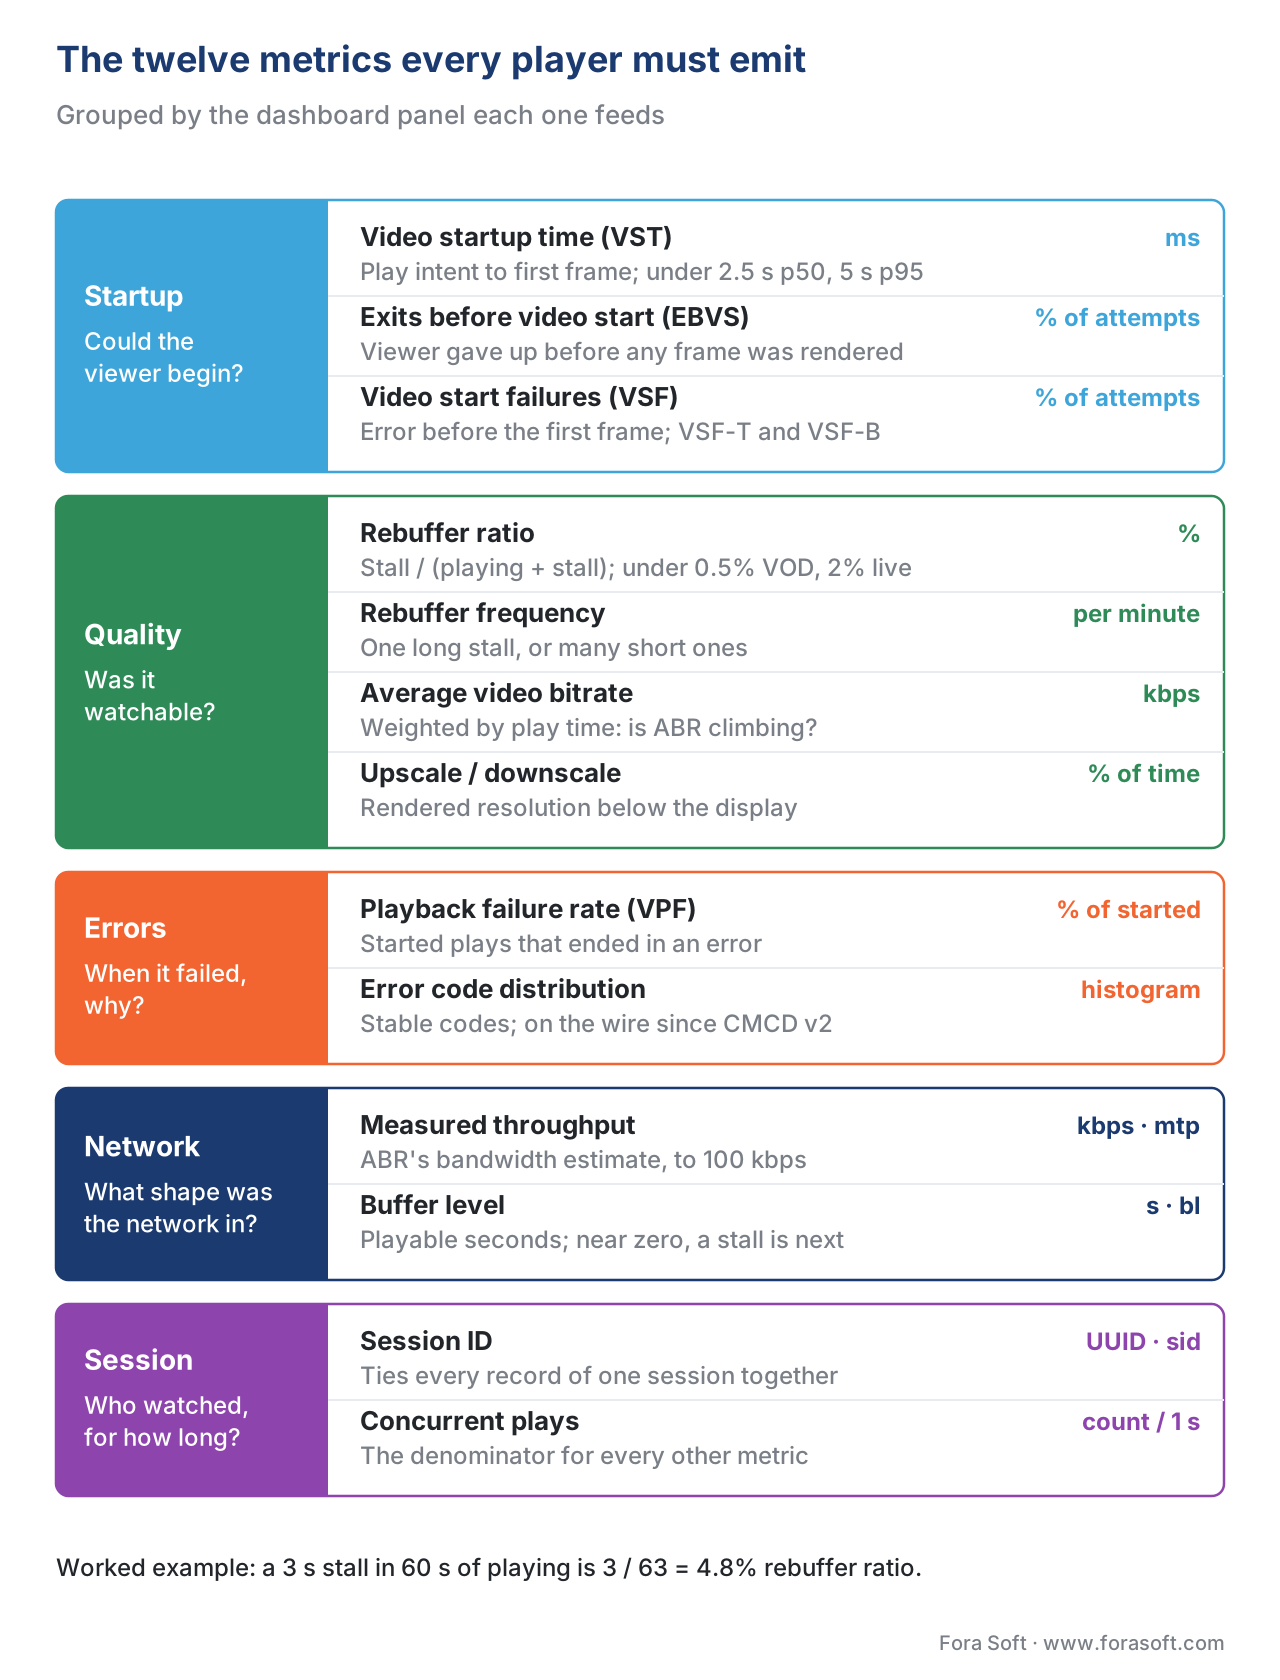 Figure 2. The twelve metrics every production player must emit, grouped by the dashboard panel they will eventually feed.
CMCD: The Open Standard for Player-to-CDN Telemetry
The first place a production player should emit telemetry is the CDN, on the same HTTP request that fetches each segment. The reason is simple: every segment request already happens; if the player attaches a small payload of state on each request, the CDN's edge logs become the system of record without any extra round-trips. The standard for that payload is Common Media Client Data, CTA-5004, published by the Consumer Technology Association's Web Application Video Ecosystem (CTA WAVE) in September 2020 and revised as CTA-5004-A (CMCD v2) in February 2026 (CTA, WAVE Common Media Client Data, 2026).
CMCD v1 defines eighteen reserved keys, organised into four header-shard groups by how often the value changes:
| Header | Volatility | Keys carried |
|---|---|---|
| CMCD-Object | Per-object | br (encoded bitrate), d (object duration), ot (object type), tb (top bitrate) |
| CMCD-Request | Per-request | bl (buffer length), dl (deadline), mtp (measured throughput), nor (next object request), nrr (next range request), su (startup) |
| CMCD-Status | Cross-request | bs (buffer starvation), rtp (requested max throughput) |
| CMCD-Session | Per-session | cid (content ID), pr (playback rate), sf (streaming format), sid (session ID), st (stream type), v (CMCD version) |
sid, cid) into their own header, CMCD v1 lets the compressor cache them once and reuse them across hundreds of requests, paying the bytes-on-the-wire only on the first request of the session. The per-object keys (br, d, ot, tb) sit in a separate header because they change every segment.
Three transports are available: a custom HTTP header (preferred for native players that do not trigger CORS preflight), an HTTP query argument (preferred for browser-based players because adding a custom header to a cross-origin request triggers a preflight OPTIONS round-trip per unique URL), and a JSON object posted independently of the segment request (used when the player wants to send a richer payload than fits in a header) (CTA-5004, §2, September 2020). The choice is determined by the runtime: a browser hls.js application uses query arguments; a native ExoPlayer application on Android TV uses headers; a Roku BrightScript channel sends them as query arguments because the BrightScript HTTP API exposes those most naturally.
A worked CMCD-Object header on a single segment request reads:
CMCD-Object: br=3200,d=4004,ot=v,tb=6000
CMCD-Request: bl=21300,dl=18500,mtp=48100,su
CMCD-Status: bs,rtp=12000
CMCD-Session: sid="6e2fb550-c457-11e9-bb97-0800200c9a66",cid="faec5fc2-ac30-11ea-bb37-0242ac130002",pr=1.0,sf=d,st=v
Translated: the player is requesting a 3,200 kbps video segment lasting 4,004 ms; it has 21.3 s of buffer; it needs the segment within 18.5 s to avoid an underrun; it estimates throughput at 48.1 Mbps; this is a startup request (the player has just begun and the segment is needed urgently); the buffer underran since the previous request (the bs flag is present); the player will accept no more than 12 Mbps of delivery throughput; the session ID and content ID identify the playback session and the asset; the stream format is DASH; the stream type is video-on-demand (CTA-5004, §6.1, September 2020).
What CMCD v2 added in February 2026
CMCD v2 (CTA-5004-A, published February 2026) is a strict superset of v1 and changes three things that matter for observability (Einbliq.io, CMCD v2 is officially released, February 2026; CTA, CTA-5004-A, February 2026):
True playback state tracking. v1 forced the analytics backend to reconstruct viewer state from the timing of segment requests; v2 adds explicit state fields for "starting", "buffering", "seeking", "paused", and "playing" that the player sets directly. The classic "is this a real rebuffer or is the viewer paused" guess that every v1-era backend had to make goes away.
Standardised error reporting. v1 had no error code field at all; an analytics vendor had to map vendor-specific error taxonomies on its own. v2 adds a native error code field with a published code namespace, so a Widevine licence rejection on one player and the same rejection on another player carry the same code.
Event mode — direct-to-collector transport. v1 piggybacked on CDN requests, which meant your analytics latency was bounded by CDN log delivery latency (often hours). v2 adds an Event Mode that lets the player POST a CMCD record directly to a third-party HTTP endpoint outside the segment request flow. Two consequences: real-time analytics become possible without a separate vendor SDK, and the player can fire records on triggers (a buffer-starvation event, an error) rather than only on segment requests.
The practical upshot of v2 for a streaming team in 2026 is that the case for shipping a heavy proprietary analytics SDK has weakened materially. A v2-capable player emits enough of the relevant state directly that a small in-house collector can stand in for a large vendor SDK on the cheap-and-cheerful path. We return to the build-or-buy decision below.
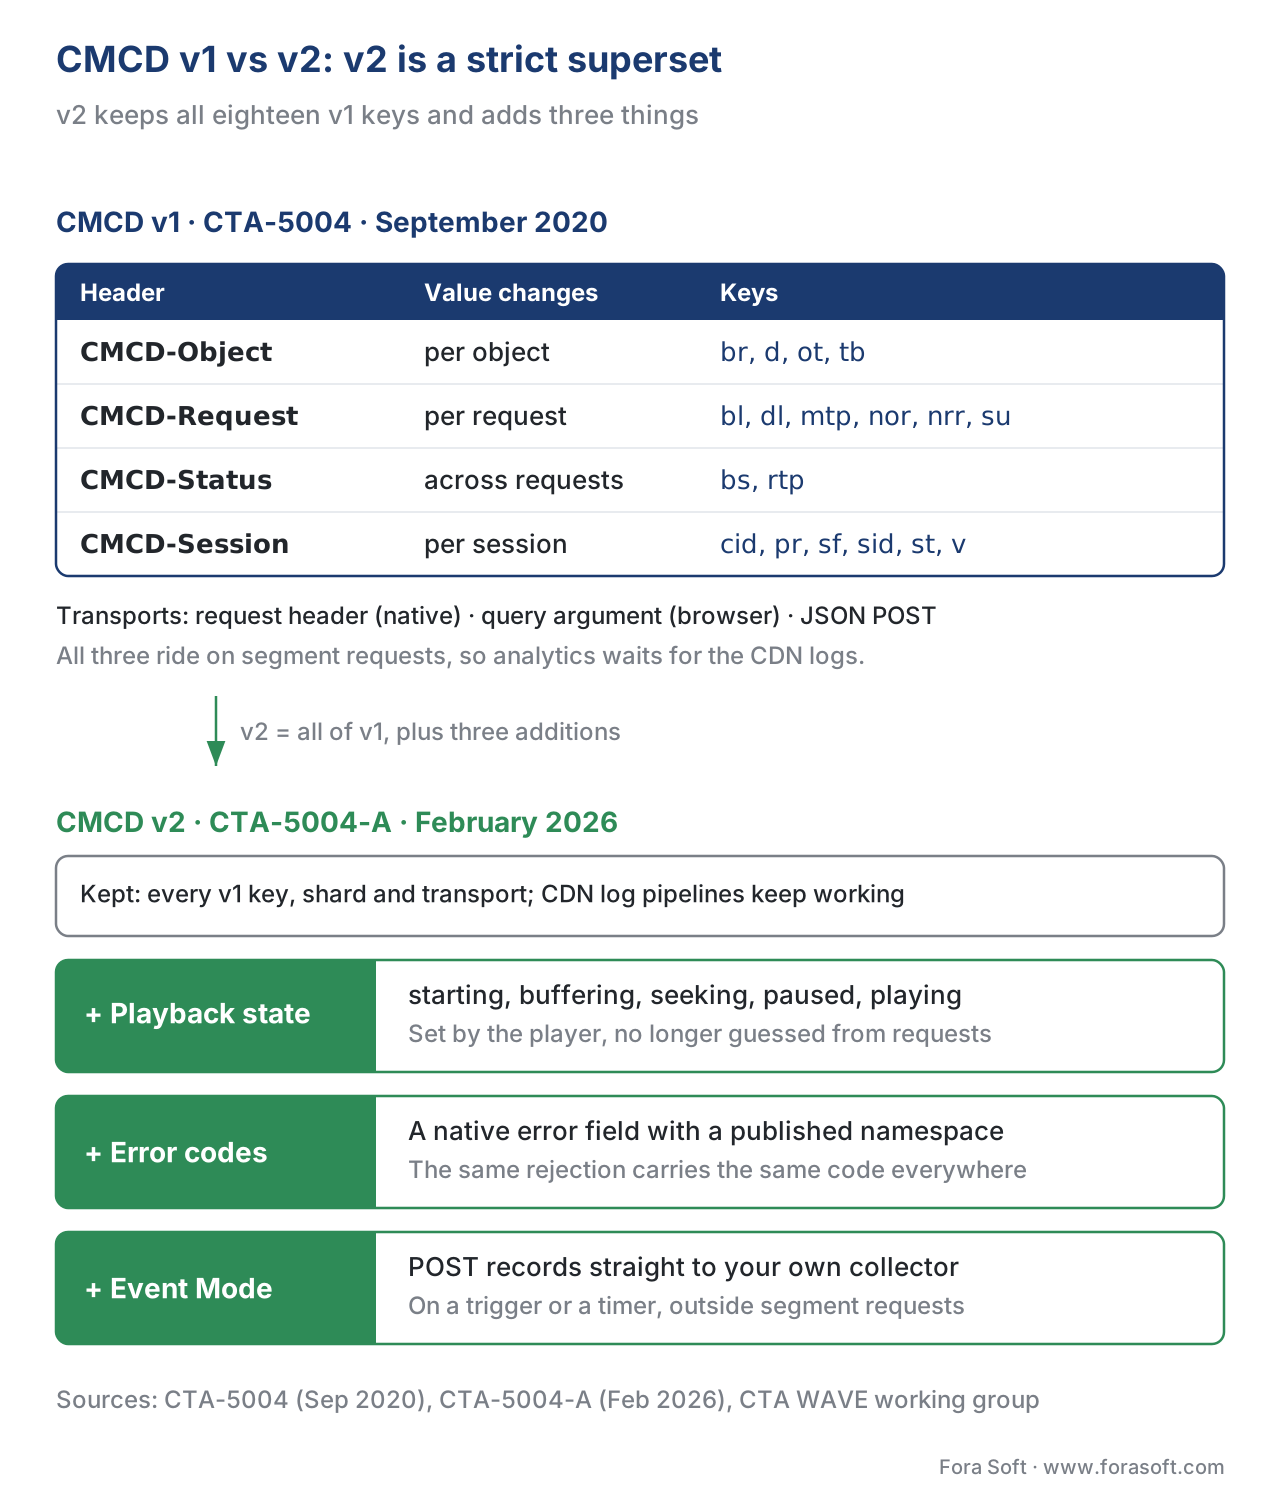 Figure 3. CMCD v1 (CTA-5004, September 2020) and CMCD v2 (CTA-5004-A, February 2026). v2 is a strict superset; the existing v1 keys keep their semantics and v2 adds explicit playback state, a standardised error code field, and the Event Mode direct-to-collector transport.
CMSD: The Server's Half of the Conversation
The complement to CMCD is CTA-5006, Common Media Server Data (CMSD), which standardises the response side. Where CMCD carries client→CDN signals on the request, CMSD carries CDN→client signals on the response: the CDN's view of its own state, the estimated time the segment will take to arrive, the cache status (hit, miss, refresh), the CDN node ID, and content-steering hints. A player that emits CMCD and reads CMSD on the response closes the loop: now the same record carries both the player's view ("I needed this segment in 1.2 seconds; my buffer is at 21.3 seconds; throughput is 48 Mbps") and the CDN's response ("the segment took 180 ms to deliver from edge-pop-LHR-04; cache HIT; estimated round trip time 38 ms"). The two together are what the dashboard needs to attribute a rebuffer to a specific edge node or a specific ISP.
CMSD is the less-deployed of the two — many CDNs began returning CMSD only in 2024 and 2025 — but the trajectory is clear and a 2026 player implementation should be reading the CMSD headers wherever the CDN populates them.
The Player Lifecycle, As Events
A player session produces a long, ordered series of events. The instrumentation pattern that has held up across web players (hls.js, Shaka, dash.js, Video.js v10) and native players (ExoPlayer on Android, AVPlayer on iOS, the Roku Video node, the Tizen AVPlay API) is the same: hook every meaningful lifecycle event, attach a timestamp and the current player state, and emit the record. The minimum event set for production:
player_ready— the player has loaded its code and is waiting for a source.request— the viewer's intent to play is registered (the play button click, the autoplay attempt). The timestamp here is the denominator for video startup time.manifest_loaded— the manifest fetch completed and the player has parsed it.playing— the first frame has been rendered. Numerator for video startup time.rebuffer_start— the buffer drained to a level the player considered insufficient and playback stalled. The classic state-change event.rebuffer_end— the buffer refilled enough to resume playback.seekingandseeked— the viewer dragged the playhead.pauseandplay— the viewer paused and resumed.bitrate_switch— the ABR algorithm switched renditions, withfrom,to, and a reason code (throughput_low,throughput_high,manual,buffer_low).error— any player error, with a stable code, a vendor sub-code, and a structured cause.ad_break_startandad_break_end— useful for separating content QoE from ad QoE.ended— the stream reached natural end.view_end— the viewer abandoned, navigated away, or closed the tab. The denominator for exits-before-video-start.
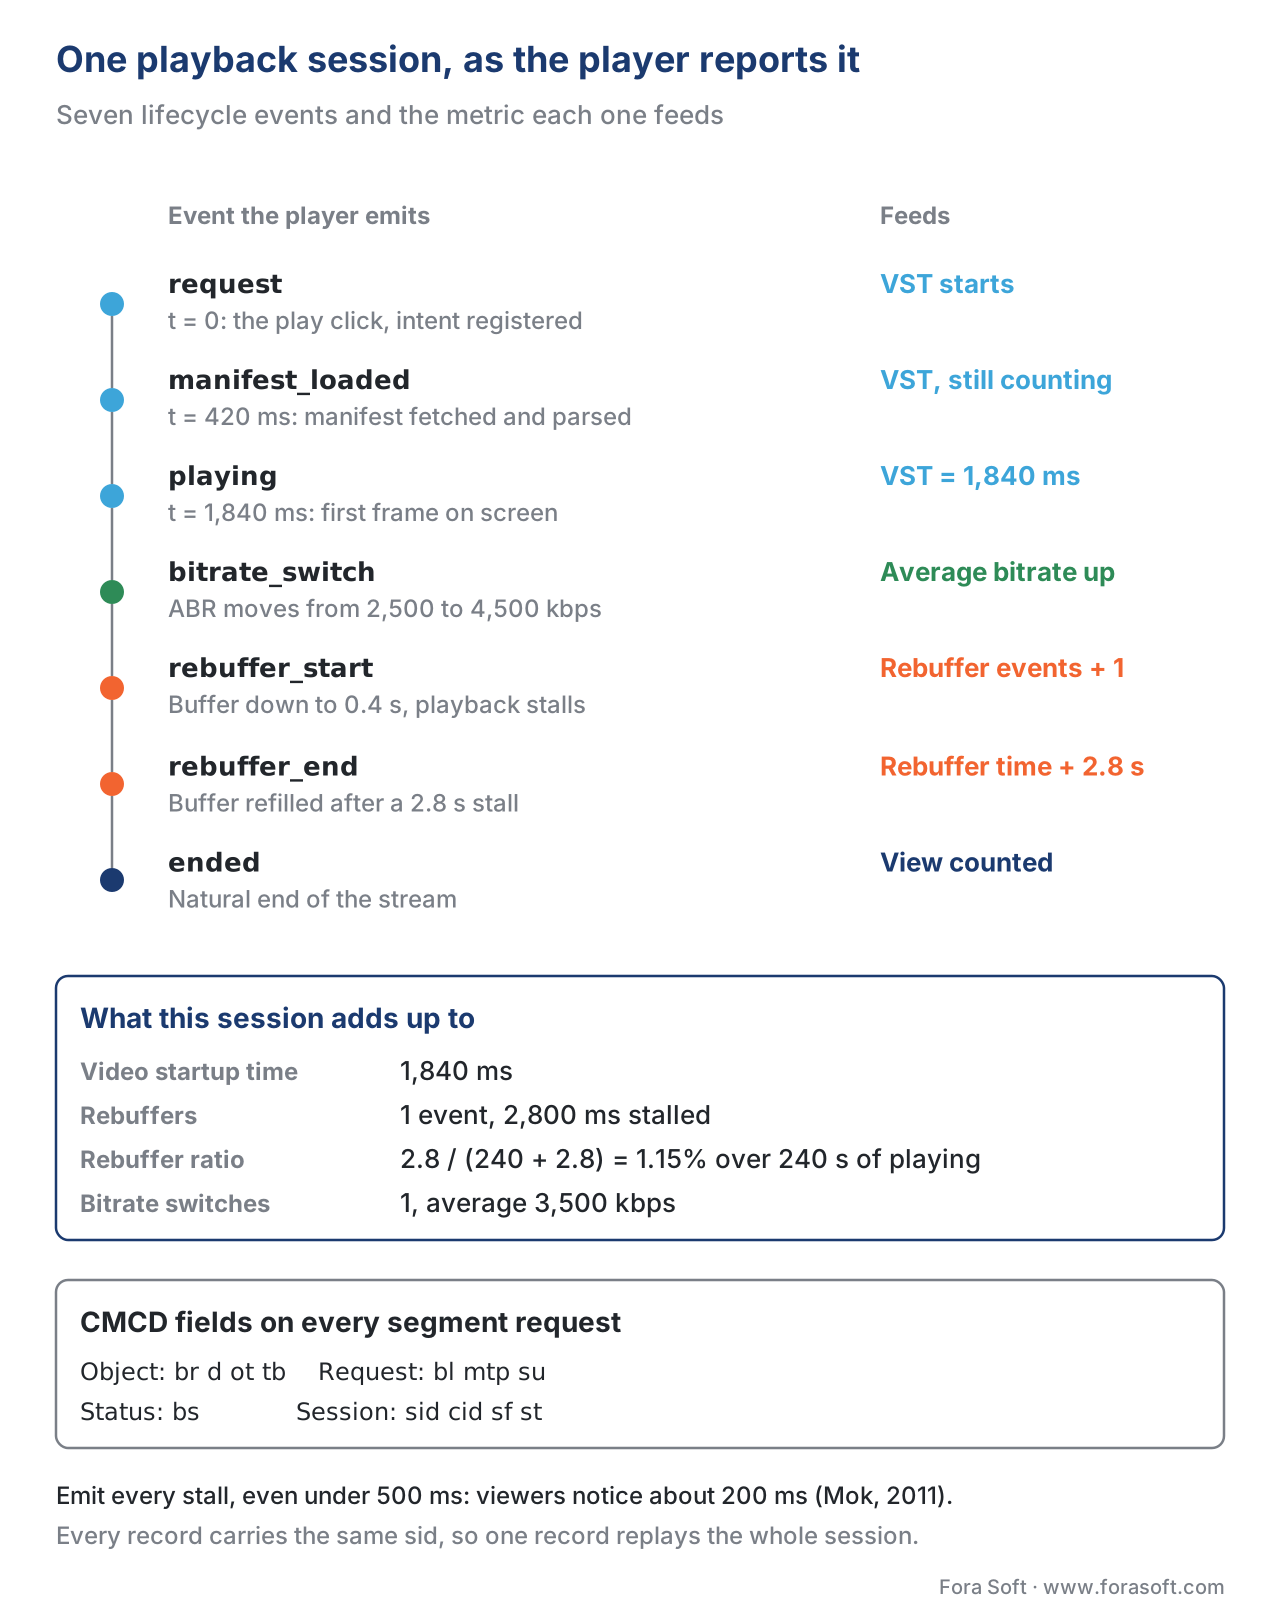 Figure 4. One playback session, as the instrumentation sees it. Each event is timestamped at the moment it fires; the events together reconstruct the session and feed the twelve core metrics.
A common mistake every team makes once is treating these events as advisory and emitting only what is convenient — for example, suppressing rebuffer_start events shorter than 500 ms on the assumption that they are not viewer-visible. They are viewer-visible (Mok et al. 2011 measured the perceptual threshold at around 200 ms), and the suppressed events are exactly the ones that diagnose ABR-induced micro-stalls during bitrate switches. Emit every event, always; sample on the backend if cardinality is a cost concern, never on the device.
Three Failure Modes the Twelve Metrics Catch
A streaming product running with the instrumentation above will see three classes of production failure that an under-instrumented product cannot diagnose:
The regional brownout. A single ISP in a single metro begins to throttle the CDN POP closest to its subscribers. From the CDN's view, request rates and error rates are normal everywhere else and the affected POP sees normal status codes (the throttle is happening upstream of the POP, in the ISP's last-mile network). From the dashboards your players produce, the rebuffer ratio in the affected metro jumps from 0.5% to 4.2% over fifteen minutes; the measured-throughput distribution in that metro's CMCD records shifts down by 60%. The metro is identifiable from the IP-to-geo lookup that runs over the session records, the ISP is identifiable from the ASN, and the time correlation localises the change. A team with this instrumentation has the data to call the CDN's account team within thirty minutes with a specific diagnosis and a specific POP-to-ASN pair. A team without it learns about the brownout from a viewer thread on Reddit.
The bad encode. A late-night encoding job ships a content asset whose top rendition was packaged with a corrupt SEI message. Most players play it without complaint; one specific player version on one specific TV firmware throws a decoder error two minutes into playback. The error code histogram, sliced by player version and TV firmware, shows the spike. The session reconstruction shows that the failure is content-specific. The fix is to re-encode the asset; the discovery is in the first hour after publication if observability is right and weeks later if it is not.
The DRM licence-server brownout. Your Widevine licence server's certificate is being renewed and the new certificate's intermediate chain is missing one cross-signed root. Most clients accept it; one specific Android TV firmware does not. Players on the affected firmware fail at the licence acquisition step; the error code histogram, sliced by DRM scheme and firmware, isolates the failing combination. The CMCD sid and cid fields let you replay the session against the licence-server logs and confirm the failing requests. Resolution in minutes once you can see the data.
In each case the resolution path is the same: an alert fires on a metric that moved, a dashboard cut by a dimension identifies the affected segment of the viewer population, the session records under that segment are inspected, and the failure mode is named. The instrumentation is what makes that path possible. Article 9.11 (incident response for streaming) covers the playbook in detail; this article covers what the playbook is built on.
Build It Yourself, or Buy a Vendor SDK
The biggest decision a streaming team makes in this area is whether to ship one of the proprietary analytics SDKs — Mux Data, Conviva, Bitmovin Analytics, Datazoom, NPAW — or to instrument the player yourself and run the backend in-house. The decision changed in 2026 because CMCD v2's Event Mode reduced the structural advantage the vendor SDKs had: a CMCD-v2-capable player can now POST rich, real-time records to a collector you operate, without a third-party SDK in the binary.
A decision tree that has worked for us on real client projects:
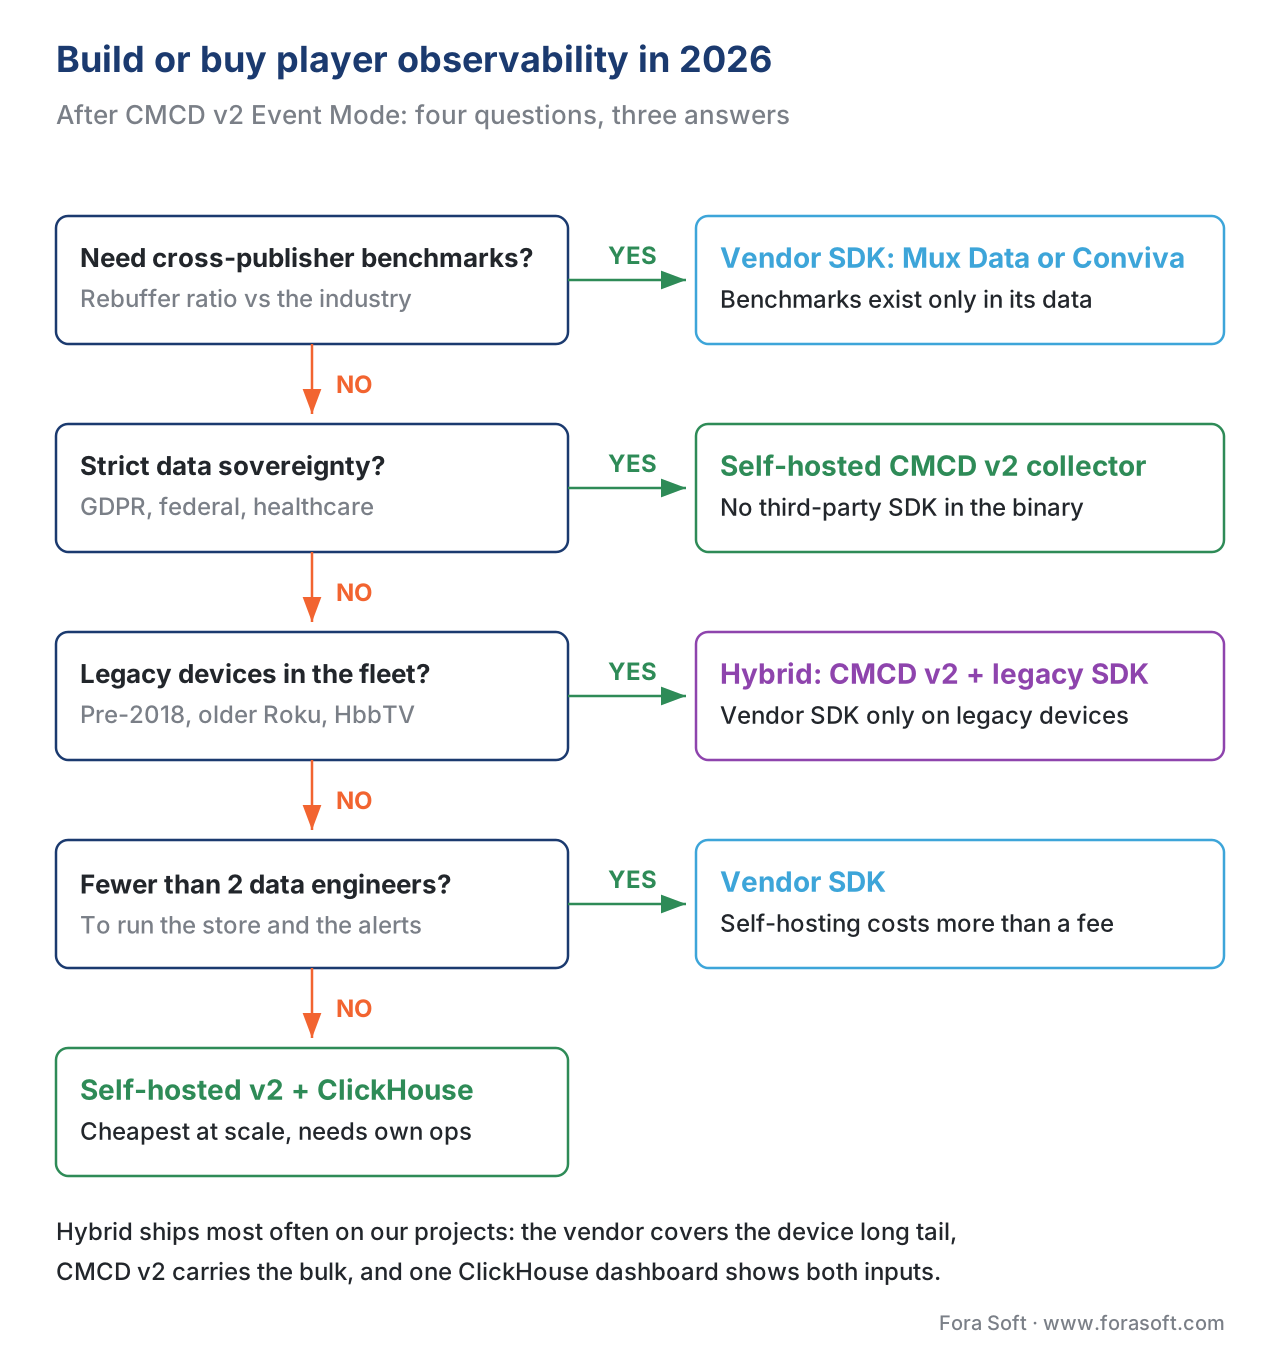 Figure 5. The build-or-buy decision for player observability in 2026, after CMCD v2. The tree resolves to one of three answers: a single full-service vendor (Mux Data or Conviva), a self-hosted CMCD v2 collector with an in-house analytics layer, or a hybrid where CMCD v2 carries the bulk and a vendor SDK ships only on legacy devices that pre-date the v2 era.
The short summary of the tree:
A team that needs cross-publisher benchmarking (your dashboard says "your rebuffer ratio is 0.6%; the industry median for live sport is 1.8%") wants a vendor with a large customer base because that benchmark exists only inside the vendor's aggregated data. Mux Data and Conviva are the two with credible benchmarks. Conviva publishes its Streaming Performance Index by region and content type; Mux exposes percentile bands across its customer base in the dashboard.
A team with strict data sovereignty requirements — European broadcasters under GDPR, US federal contracts, regulated healthcare in telemedicine products — usually cannot ship a third-party SDK that sends viewer data to a vendor's US-hosted backend. The self-hosted CMCD v2 path is the right answer here; the vendor SDKs are not.
A team that ships only on modern devices (browsers and TVs from 2023 onward) can rely on the CMCD path because the players ship with CMCD-capable HTTP stacks. A team that ships on legacy HbbTV devices, older Roku models, or anything pre-2018 still needs a vendor SDK because those devices do not have a path to emit CMCD reliably, and the SDK is the only practical instrumentation layer.
A team with a small in-house data engineering function — fewer than two engineers who can keep a ClickHouse or BigQuery analytics store running — should not self-host. The total cost of operating the storage, the alerting layer, the dashboards, and the dimensional model exceeds a vendor's annual fee almost always, and the failure modes (a stalled cluster on a Saturday night during the Champions League final) are worse.
The hybrid pattern that ships most often on the projects we ourselves run: CMCD v2 on the segment-request path for every modern player, a vendor SDK only on the legacy devices, and a single ClickHouse-backed dashboard that unifies both inputs. The vendor handles the long tail of device coverage; the self-hosted layer handles the bulk and gives the team direct access to the raw records for ad-hoc debugging.
A Common Mistake: Treating Sampling as a Backend Problem
A mistake we have seen on three separate client projects, costly in each case, is to push sampling down into the player — emitting events only one session in ten because "the volume will be too high otherwise". The reason it is costly is that every session you choose not to emit is invisible to your debugger when that session is the one that failed, and the failures that matter for steady-state QoE are concentrated in the long tail (the 99th percentile device, the slowest ISP, the cold-start cache miss) that under-sampling makes invisible by definition. The discipline is the opposite: emit every event from every session; sample on the backend at query time; pay the storage cost for the right-tail records that diagnose the production failures you actually need to fix. Storage is cheaper than not knowing.
A linked mistake: pre-aggregating in the player. The temptation is to compute the session's rebuffer ratio on the device and emit only the rolled-up number. The cost is that you have just thrown away every dimension on which you might want to slice the data later — device firmware, CDN node, ad break boundary, ISP, ABR switch reason. Always emit the raw events; aggregate on the backend.
Free download: Player Observability Metric PackA one-page A4 reference card with the twelve core metrics: the definition, unit and formula of each, the player event that produces it, and the CMCD field that carries it on the wire. Keep it next to the dashboards you build from it.Where Fora Soft Fits In
The same player observability stack lands across every video vertical Fora Soft builds for. In OTT and Internet TV products we ship CMCD-instrumented players on web and TV platforms and pipe the events into either a vendor backend or a self-hosted ClickHouse store, depending on the client's data sovereignty requirements. In WebRTC products — video conferencing, telemedicine, e-learning, AR/VR — the equivalent observability layer is getStats() aggregation, with the same discipline applied to the WebRTC metrics catalogue (RTCInboundRtpStreamStats, RTCOutboundRtpStreamStats, RTCIceCandidatePairStats) and the same separation of emission from analytics. In video surveillance products the metrics that matter are recording continuity and stream-availability uptime rather than rebuffer ratio, but the architecture is unchanged: instrument the player, ship structured records, build the dashboard from the data the player actually emitted. Our video streaming software development team ships CMCD-instrumented players and the analytics store behind them, and for live products with playback problems our software troubleshooting and optimization service starts from exactly these metrics.
The book
Video Streaming: A Complete Guide to Video Delivery: From ABR and CDNs to Players, WebRTC, DRM, and the Economics of Streaming
This article is about what the player has to report: twelve metrics, the lifecycle events behind them and CMCD on the wire. Book 3 covers what those numbers are measuring: how ABR algorithms pick a rung, how web, mobile and TV players buffer and recover from stalls, how CDNs cache and bill the bytes, and how QoE monitoring turns a dashboard into a fix. Written by Nikolay Sapunov, CEO at Fora Soft.
Can your player tell you why a viewer stalled?
Send us your player stack, your target devices and the dashboards you run today, and we will map which of the twelve metrics you already emit, where CMCD v2 can replace a vendor SDK, and what a self-hosted or hybrid pipeline would cost you to run. 250+ video products shipped since 2005.
See our case studies
Case study
Drundoo
Bulgarian internet TV with 60 live channels plus movies, series and catch-up: the web-plus-TV player fleet where error codes have to be sliced by device and firmware.
Case study
Worldcast Live
Concert streaming to 10,000 simultaneous viewers at 0.4–0.5 s latency and 1.5 Gb/s, where one stall during a live set reaches everyone at once.
Case study
VALT
HIPAA- and GDPR-compliant video recording for 770+ U.S. organizations and 50,000+ users, where recording continuity and stream uptime are the metrics that matter.
What to read next
Monitoring
QoE Metrics: What Every Dashboard Should Show
The next layer up: how the metrics this article emits become the panels and alerts your team watches.
Monitoring
Analytics Platforms: Mux Data, Conviva, Bitmovin Analytics, Datazoom, NPAW
The vendor side of the build-or-buy decision, compared platform by platform.
Players
Streaming Player End to End
The player anatomy this observability layer instruments, from manifest to rendered frame.
Operations
Incident Response for Streaming: The Playbook
What to do in the first hour after an alert fires on one of these twelve metrics.
References
- Consumer Technology Association, CTA-5004: WAVE — Common Media Client Data (CMCD), September 2020. https://cdn.cta.tech/cta/media/media/resources/standards/pdfs/cta-5004-final.pdf — the canonical specification; §3.3 defines the eighteen reserved keys and their semantics; §6 carries the worked header, query-arg, and JSON examples this article paraphrases.
- Consumer Technology Association, CTA-5004-A: WAVE — Common Media Client Data v2, February 2026. https://www.cta.tech/standards/wave-common-media-client-data/ — the v2 revision; adds playback state, native error codes, and the Event Mode direct-to-collector transport.
- CTA WAVE non-binding HTML mirror of CMCD v2: https://cta-wave.github.io/Resources/common-media-client-data--cta-5004-a.html.
- Consumer Technology Association, CTA-5006: WAVE — Common Media Server Data (CMSD). https://www.cta.tech/standards/wave-common-media-server-data/ — the server-side complement; the article cites it only by reference because the body's scope is the player side.
- cta-wave/common-media-server-data GitHub repository (working-group discussion archive): https://github.com/cta-wave/common-media-server-data.
- Mux, Understand Mux Data metric definitions, 2026. https://www.mux.com/docs/guides/understand-metric-definitions — vendor metric catalogue; the cross-reference for the article's metric definitions.
- Mux, Rebuffering Metrics to help you Troubleshoot your Video Pipeline, 2024. https://www.mux.com/blog/recover-from-rebuffering-mux-metrics-explained.
- Mux, The Video Startup Time metric explained, 2023. https://www.mux.com/blog/the-video-startup-time-metric-explained.
- Conviva, OTT 101: Top 5 Metrics that Matter for Tech Ops, 2024. https://www.conviva.com/blog/ott-101-top-5-metrics-that-matter-for-tech-ops/.
- Conviva, OTT 101: Your Guide to Streaming Metrics that Matter, 2024. https://www.conviva.com/ott-101-your-guide-to-streaming-metrics-that-matter/.
- Conviva, Streaming Performance Index, 2024. https://docs.conviva.com/learning-center-files/content/ei_application/ea-features/spi_intro.htm — the SPI documentation; defines EBVS, VSF, VPF, VST.
- Einbliq.io, CMCD v2 is officially released, February 2026. https://einbliq.io/cmcd-v2-is-officially-released/ — first practitioner write-up of CMCD v2 with the working-group's perspective on what changed.
- Amazon Web Services, Improving video observability with CMCD and CloudFront, 2024. https://aws.amazon.com/blogs/networking-and-content-delivery/improving-video-observability-with-cmcd-and-cloudfront/ — CloudFront's CMCD support and edge-log integration.
- Google Cloud, Media CDN: Enhancing streaming observability with CMCD metrics, 2024. https://cloud.google.com/media-cdn/docs/cmcd.
- Shaka Player, CmcdManager API documentation, 2026. https://shaka-player-demo.appspot.com/docs/api/shaka.util.CmcdManager.html — reference implementation of CMCD inside an open-source player.
- hls.js project, API.md — cmcd configuration, 2026. https://github.com/video-dev/hls.js/blob/master/docs/API.md — hls.js's CMCD wire-up.
- Bitmovin, CMCD: Quality of experience — what it is and the benefits, 2024. https://bitmovin.com/blog/cmcd-video-streaming-optimization/.
- F. Dobrian, V. Sekar, A. Awan, I. Stoica, D. Joseph, A. Ganjam, J. Zhan, and H. Zhang, Understanding the Impact of Video Quality on User Engagement, SIGCOMM 2011. https://dl.acm.org/doi/10.1145/2018436.2018478 — the foundational empirical paper that established rebuffer ratio's relationship to viewer abandonment.
- R. K. P. Mok, E. W. W. Chan, and R. K. C. Chang, Measuring the Quality of Experience of HTTP Video Streaming, IFIP/IEEE IM 2011. https://ieeexplore.ieee.org/document/5990550 — the perceptual-threshold paper for rebuffer events.
- CTA WAVE GitHub working-group archive for CMCD: https://github.com/cta-wave/common-media-client-data.
