


Why This Matters
If you ship video to viewers, you ship money — and analytics is the only instrument that tells you, in time to act, whether the money is leaking through buffering, startup failures, ad stalls, regional outages, or simply through people who never come back. The wrong analytics choice locks an OTT business into either a bill it cannot defend (an enterprise platform priced for Disney+ on a company doing 100,000 views a day) or a tool that misses the events that matter (a developer-tier SDK that cannot model an ad-pod stall on Roku). The right choice gives your CFO a single number that moves with revenue, your engineers a session-level trace that finds the bad device-OS-CDN combination in under a minute, and your product team a leading indicator for churn three weeks before the cancellation curve bends.
This article is the tenth piece of Block 9 inside Fora Soft's Video Streaming Learn corpus, the buyer's guide that closes the loop opened by QoE Metrics: What Every Dashboard Should Show. It is written for the person who has to choose: a product manager doing a vendor selection, a founder doing a build-vs-buy review, a head of operations rebaselining the tool the company picked four years ago. A senior engineer will leave with the SDK footprints, the data pipelines, the CMCD v2 export story, and the integration costs. A product or commercial reader will leave with the pricing models, the verticals each vendor wins, the cannibalisation against Google Analytics 4, and the three decision triggers that should push you from one tier to the next.
The Job an Analytics Platform Actually Does
A streaming-analytics platform is four pieces, glued together by a contract.
The first piece is the collector — a small SDK that lives inside every player session (web, iOS, Android, Roku, Tizen, webOS, Vidaa, Fire TV, smart-TV browsers) and emits an event every time the player starts, buffers, errors, switches rendition, or stops. CTA-5004-A — Common Media Client Data version 2, published in February 2026 — standardised the fields a player should expose, so a modern collector can grab those values directly instead of re-implementing detection on every platform.
The second piece is the ingest pipeline — a low-latency network of regional collectors that receive the event stream, dedupe it, attach IP-derived dimensions (country, ASN, ISP, device class, CDN edge POP), and forward it into a real-time database. This is the part of the platform where Conviva's patented Time-State technology and NPAW's "no granularity compression" claims live; both vendors argue that the way they reconcile events into per-session state is the moat that separates a serious enterprise tool from a generic event bus.
The third piece is the metrics layer — the engine that turns the raw events into the six core Quality of Experience metrics defined in CTA-2066 (Video Start Failure, Exit Before Video Start, Video Startup Time, Rebuffering Ratio, Video Playback Failure, Picture Quality) plus the long tail of diagnostics (bitrate switches, ad-pod completion rate, region-by-CDN startup time, device-OS error matrices). The metrics layer is where vendor opinions show up: Mux Data's Viewer Experience Score, Conviva's Streaming Performance Index, Bitmovin Analytics' QoE Score, and NPAW's Happiness Score are all composite numbers calibrated on the same underlying events but weighted by each vendor's research on which metrics best predict abandonment in their own customer base.
The fourth piece is the dashboard and alerting surface — the UI a human looks at, the API a script queries, the AI assistant a non-technical user asks a question in plain language. By 2026 every vendor in this category ships an AI assistant: Conviva has Nexa, NPAW has NaLa, Bitmovin pairs its Observability MCP Server with the Stream Lab MCP Server so coding agents can read QoE data directly. The differentiation in this layer is increasingly about workflow — how fast can a human or an agent move from "the dashboard turned red" to "I know which CDN to fail over from" — rather than about the raw metric set, which has commoditised.
A fifth piece, which Datazoom owns alone, is the vendor-neutral data layer. Datazoom sits between the collectors and whatever destination the operator has chosen — a Google BigQuery warehouse, Snowflake, Splunk, Google Analytics 4, an in-house Kafka topic — and normalises the event stream so the operator can build its own metrics layer or pipe the data into the analytics platform of its choice. The platform expanded in November 2025 with the Base Collector that extends the same approach beyond video to the full user journey. Datazoom is not a competitor to the other four in the traditional sense; it is a tool that lets an operator route around the lock-in the other four create.
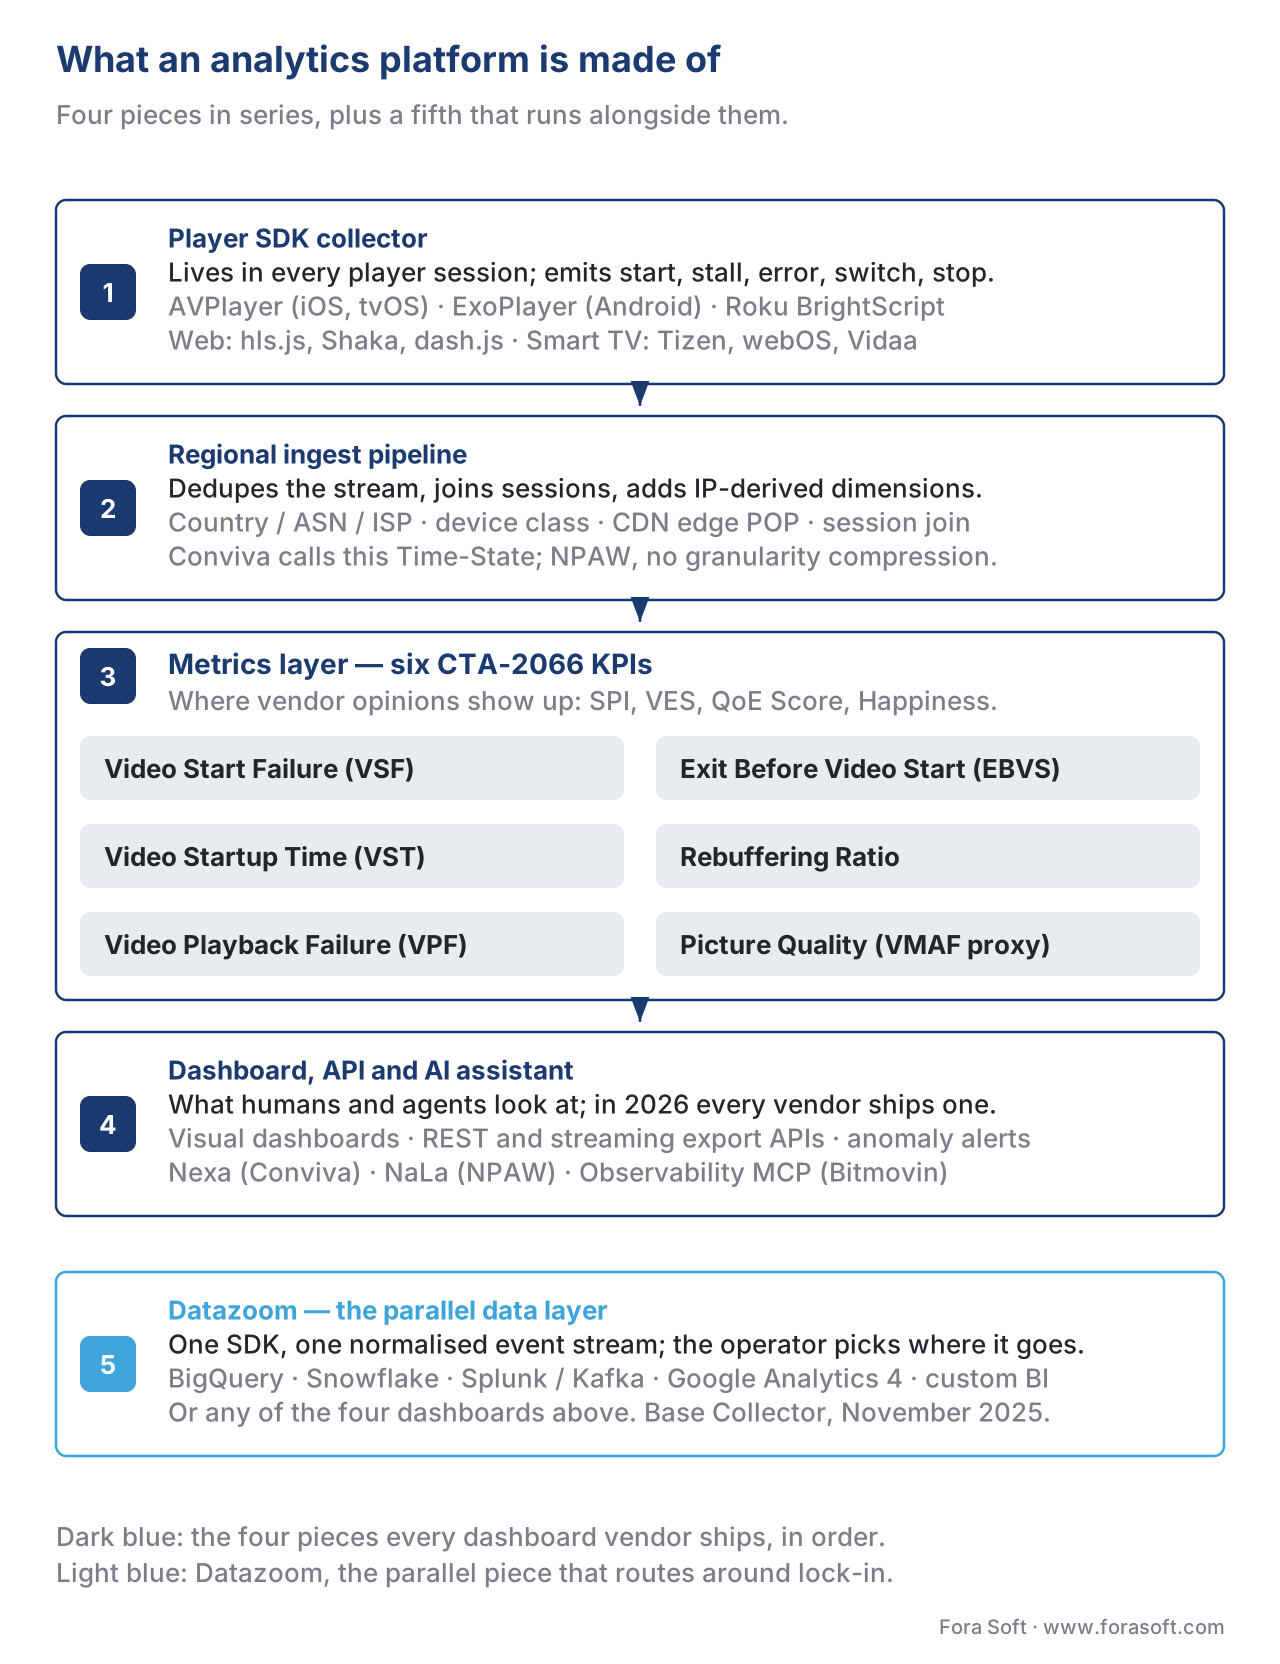 Figure 1. The four pieces every analytics platform ships, plus the fifth Datazoom owns alone. The metrics layer is where vendors disagree; the SDK and the ingest pipeline are where they look the same on a slide and feel very different in production.
The Five Vendors, in One Paragraph Each
Conviva — the enterprise category leader
Conviva, founded in 2006 as a spin-out from Carnegie Mellon research on adaptive streaming and online algorithms, is the analytics platform every tier-1 OTT brand benchmarks against. Surveys of OTT operators consistently place its market share around 16% — first in the category — and its customer roster reads as the public list of premium streaming services (Disney+, HBO Max, Paramount+, Sky, BBC iPlayer, DAZN, BT Sport, and most of the major sports rights holders). The platform's distinguishing technology is the patented Time-State engine, which Conviva says computes stateful per-session metrics ten times more efficiently than a generic stream-processing platform, allowing the company to keep every session at full per-event granularity rather than sampling. The AI surface — anomaly detection through AI Alerts, natural-language queries through Nexa, visual dashboards through Pulse — is the most mature in the category. The trade-off is price: Conviva does not publish a list price, but enterprise contracts in 2026 typically start in the low-six-figures annually and scale with viewer count, region, and the number of business units. The vendor is the right answer when you are large enough that a five-minute incident costs more than a year of analytics, and when your operations team has the headcount to run the dashboards Conviva can build.
Mux Data — the developer-first option
Mux Data is the analytics arm of Mux, the API-first video infrastructure company founded in 2016 by veterans of Zencoder and YouTube. The product is built around the same opinion that drove Stripe to dominate payments and Twilio to dominate telephony: developers will pick the tool they can integrate in an afternoon and budget in a spreadsheet. Mux Data is included free with every Mux Video stream, and is sold standalone at $0.50–0.60 per 1,000 plays with no commitment, sitting roughly ten to twenty times cheaper than Conviva on a per-play basis at small and medium scale. The SDK story is the cleanest in the category — first-party SDKs for AVPlayer (iOS, tvOS), ExoPlayer (Android, Android TV, Fire TV), Roku BrightScript, hls.js, Shaka Player, dash.js, Video.js, THEOplayer, JW Player, and Bitmovin Player, plus a Web SDK and a server-side data API — and the integration guides actually work without a solutions engineer on a call. The metrics surface is opinionated but pragmatic: a Viewer Experience Score, the six CTA-2066 core metrics, and a clean SSAI/CSAI breakdown that catches ad-induced stalls. The trade-off is depth at scale: Mux Data is excellent up to roughly the volume that turns the bill from a four-figure to a five-figure number, then the dashboards begin to feel narrower than what an enterprise operations team would build in Conviva or NPAW. Mux offers custom enterprise plans starting around $3,000 per month, but operators at true tier-1 scale typically either migrate to Conviva or pair Mux with a custom warehouse via the Mux Data export API.
Bitmovin Analytics — the player-side specialist
Bitmovin, the Austrian-American video-infrastructure company best known for the Bitmovin Player and the Bitmovin Encoder, sells its analytics product as the natural third leg of the stack. The selling argument is precision: because Bitmovin builds the player and the encoder, its analytics SDK has access to player-internal state (rendition switches, ABR algorithm decisions, decoder errors, buffer-fill levels) that a generic SDK has to infer through public events. The 2026 product positions itself as "Observability Analytics" — a combination of session-level tracking, monetisation analysis, alerts, and AI-enhanced error debugging, with a dedicated SSAI Analytics module that breaks down ad plays, plays per quartile, and abandonment rate. Pricing is impressions-based with a free trial tier (30-day data retention, 10 full data exports per month, 3 analytics license keys included); enterprise tiers extend retention and the export volume. Market share runs around 13%, second in the surveyed category. Bitmovin Analytics is the right answer when you have already chosen the Bitmovin Player (or are planning to) and you want the deepest ABR and SSAI insight available; it is a harder sell when your players are heterogeneous (native iOS, Roku BrightScript, three different web players) because the deepest insights depend on the Bitmovin SDK family being in the loop.
NPAW — the flexibility leader, especially in EMEA
NPAW, founded in 2008 in Barcelona by Ferran Gutiérrez and Till Sudworth and originally branded as Nice People At Work and the Youbora SDK, is the third-largest player by market share (around 11% in OTT-operator surveys) and the strongest vendor among European broadcasters, telcos, and tier-2 OTT services. The platform's strengths are breadth — Video Analytics, App Analytics, Ad Analytics, CDN Balancer, and Publisher Analytics are all sold as modules of the NPAW Suite — and flexibility, with widget-based dashboards, unlimited custom metrics and dimensions, and an interface explicitly designed for non-technical users so a head of content can answer a question without filing a ticket with engineering. The AI surface (NaLa AI Assistant) accepts natural-language questions and categorises streaming issues automatically. NPAW does not publish a price; the platform is positioned for enterprise contracts but its commercial model defers revenue to the customer's growth, which makes it more accessible to mid-market operators than Conviva. The trade-off is U.S. brand presence: NPAW is dominant in EMEA and growing in LATAM, but in U.S. RFPs Conviva and Mux still capture more mindshare.
Datazoom — the vendor-neutral data layer
Datazoom, founded in 2017 in San Francisco by Jason Thibeault (the former executive director of the Streaming Video Alliance) and Diane Strutner, is the only Series-A entrant on this list and the only product that is not, strictly speaking, an analytics dashboard. Datazoom sells a single lightweight SDK that creates a standardised, real-time data layer for the entire video session and forwards normalised events to whatever destination the operator chooses — Google BigQuery, Snowflake, Splunk, Google Analytics 4, an in-house Kafka topic, or any of the other four vendors in this article (yes, Datazoom can feed Conviva or Mux Data the same way it feeds a warehouse). In November 2025 the company introduced the Base Collector, a major platform evolution that extends the model beyond video to the full user journey — e-commerce, publishing, any app — with modular video and ad extensions added on demand. Datazoom is the right answer when the operator's analytics requirements outgrow what any single dashboard can support — typically because the company already runs a data warehouse, has a data-engineering team, and wants vendor-neutral collection so that switching dashboards in three years does not require re-instrumenting fifty player implementations. The trade-off is that Datazoom is not the dashboard; the operator still needs something (a BI tool, a custom React surface, GA4, or one of the four vendors above) to look at the data.
 Figure 2. Where the five vendors sit relative to each other. Datazoom belongs in a different conversation — it sells the pipes, not the gauges.
A Worked Numeric Example: What an Analytics Bill Looks Like
The pricing models the vendors use map to dramatically different bills depending on traffic shape. Consider a hypothetical mid-market OTT operator with two million plays per day (60 million plays per month), a global footprint, an average session length of 24 minutes, and a tech-ops team of four.
For Mux Data, the standalone usage rate (taken at the higher end of the published $0.50–0.60 / 1,000 plays band) gives:
60,000,000 plays/month × $0.60 / 1,000 plays = $36,000/month, or $432,000/year.
That is the headline number; in practice, Mux discounts at this scale via custom enterprise plans (the published starting tier for those plans is $3,000/month), so the negotiated rate would likely land in the $200,000–$300,000 annual range, plus storage and bandwidth if the operator also uses Mux Video.
For Bitmovin Analytics, the impressions-based pricing is not publicly listed at this scale, but industry-benchmark figures place a 60-million-impression-per-month contract in the $180,000–$300,000 annual range, with a discount when bundled with the Bitmovin Player and Encoder.
For Conviva, the same volume — and the enterprise depth that volume implies — typically prices in the $400,000–$800,000 annual range, scaling with region count, business-unit count, and the number of named dashboards. A tier-1 sports rights-holder running global live events can pay seven figures.
For NPAW, the deferred-to-growth commercial model produces a bill that depends heavily on negotiation but typically lands 20–40% below the equivalent Conviva contract for the same volume — call it $300,000–$500,000 annual for our hypothetical operator.
For Datazoom, the pricing is usage-based on events forwarded rather than plays; for a 60-million-play-per-month operator emitting roughly 30–60 events per session, the bill typically lands in the $60,000–$120,000 annual range. But this is additive — the operator still needs to pay for whichever dashboard surface they put on top of the Datazoom feed, whether that is a custom BI implementation or one of the other four vendors.
The annual swing from cheapest to most expensive — Mux Data negotiated at $200,000 versus Conviva at $800,000 — is 4×. The right answer depends entirely on which of those numbers buys the company more business value than it costs.
Comparison Matrix: The Twelve Decisions That Actually Differ
The table below distils the choice into the twelve criteria that drive a 2026 vendor-selection decision. The shaded cell in each row indicates the vendor that wins that criterion outright; "even" indicates two or more vendors tie.
| Criterion | Mux Data | Conviva | Bitmovin | NPAW | Datazoom |
|---|---|---|---|---|---|
| Annual price at 60 M plays/mo | $200–300K | $400–800K | $180–300K | $300–500K | $60–120K (+ dashboard) |
| Time to first dashboard | hours | weeks | days | days | days (to data only) |
| Player SDK breadth | very wide | very wide | Bitmovin-focused | wide | wide |
| Depth at tier-1 scale | medium | very deep | deep | deep | n/a |
| SSAI/CSAI insight | clean | very deep | deepest (own player) | deep | depends on dashboard |
| Multi-CDN intelligence | tracks | benchmarks | tracks | balancer included | passes through |
| AI surface | charts + alerts | Nexa + AI Alerts | Stream Lab + Obs MCP | NaLa AI Assistant | n/a |
| No-code custom metrics | limited | strong (no-code builder) | limited | very strong | n/a |
| Real-time alerting | yes | yes (anomaly + AI) | yes (AI-enhanced) | yes (AI-driven) | forwards to others |
| Data export & API | strong (CSV, Kinesis, Pub/Sub) | strong (Enterprise tier) | strong (impressions tier) | strong | the entire product |
| Vendor lock-in | medium | high | high | high | the product is anti-lock-in |
| Best EMEA / non-US fit | good | good | good (Austrian) | strongest | good |
How They Actually Differ Under the Hood: Five Architectural Choices
A surface comparison shows five vendors selling the same dashboards. Five architectural choices reveal where the differences live.
Choice one: sampled vs unsampled telemetry. The cheapest way to reduce ingest cost is to drop 90% of the events and extrapolate; the cheapest way to be wrong about a regional outage is to drop those same events. Conviva and NPAW both market unsampled, full-granularity collection as a moat — Conviva via the Time-State engine, NPAW via "no granularity compression". Mux Data samples less aggressively than its developer-friendly framing suggests, but it samples; at the scale the platform is priced for, the sampling rounds out without hiding incidents. Bitmovin's collector is unsampled. Datazoom is unsampled by definition — it is the data layer; sampling is the dashboard's decision, not the collector's.
Choice two: where the metric is computed. A metric like Rebuffering Ratio can be computed in the SDK (cheap to transmit, opaque to debug), in the regional ingest layer (a middle ground), or in the cloud database after every event has been landed (expensive to transmit, transparent to debug). Mux and Bitmovin lean toward in-database computation, which means a single weird session is fully reconstructable; Conviva's Time-State engine pushes more computation upstream to keep the cloud cost manageable at tier-1 scale. The practical consequence is that Mux and Bitmovin are easier to integrate with a downstream data warehouse, and Conviva is easier to operate at petabyte scale.
Choice three: how CMCD v2 is consumed. CTA-5004-A standardised the fields a player should expose to the CDN, but it also defined a richer event vocabulary the analytics layer can read. By mid-2026, every vendor in this article consumes CMCD v2 — but they consume it differently. Mux and Bitmovin pull CMCD fields directly into the dashboard's primary metrics layer, treating them as first-class signals. Conviva and NPAW use CMCD as a confirmation signal that complements their own SDK telemetry. The practical consequence: if you cannot ship the vendor's SDK on a particular platform (a custom Tizen build that resists a third-party SDK, for example), Conviva and NPAW have a harder time covering you than Mux or Bitmovin do.
Choice four: how the AI assistant grounds its answers. Conviva's Nexa, NPAW's NaLa, and Bitmovin's Observability MCP Server are not the same kind of product. Nexa is tightly grounded in Conviva's Time-State metrics catalogue and is conservative about claims it cannot derive from the catalogue. NaLa is a broader assistant that categorises issues and accepts more open-ended questions. Bitmovin's MCP server is built for the agentic era explicitly — it exposes the QoE data through the Model Context Protocol so a coding agent (or a third-party application) can query it. The practical consequence: if you want a chat box your head of content uses, Nexa and NaLa are the closer fit; if you want an agent that builds bug repros from production data, Bitmovin's MCP server is the cleanest hook.
Choice five: build-vs-buy reversibility. Datazoom's entire premise is that the analytics dashboard is replaceable and the data layer is not. The other four vendors disagree by construction: their SDK is the front door to their dashboard. If you choose Mux, Conviva, Bitmovin, or NPAW, you choose to migrate fifty player implementations the day you switch. If you choose Datazoom plus one of the four, you choose to migrate a configuration the day you switch — at the cost of paying for the data layer separately from the dashboard.
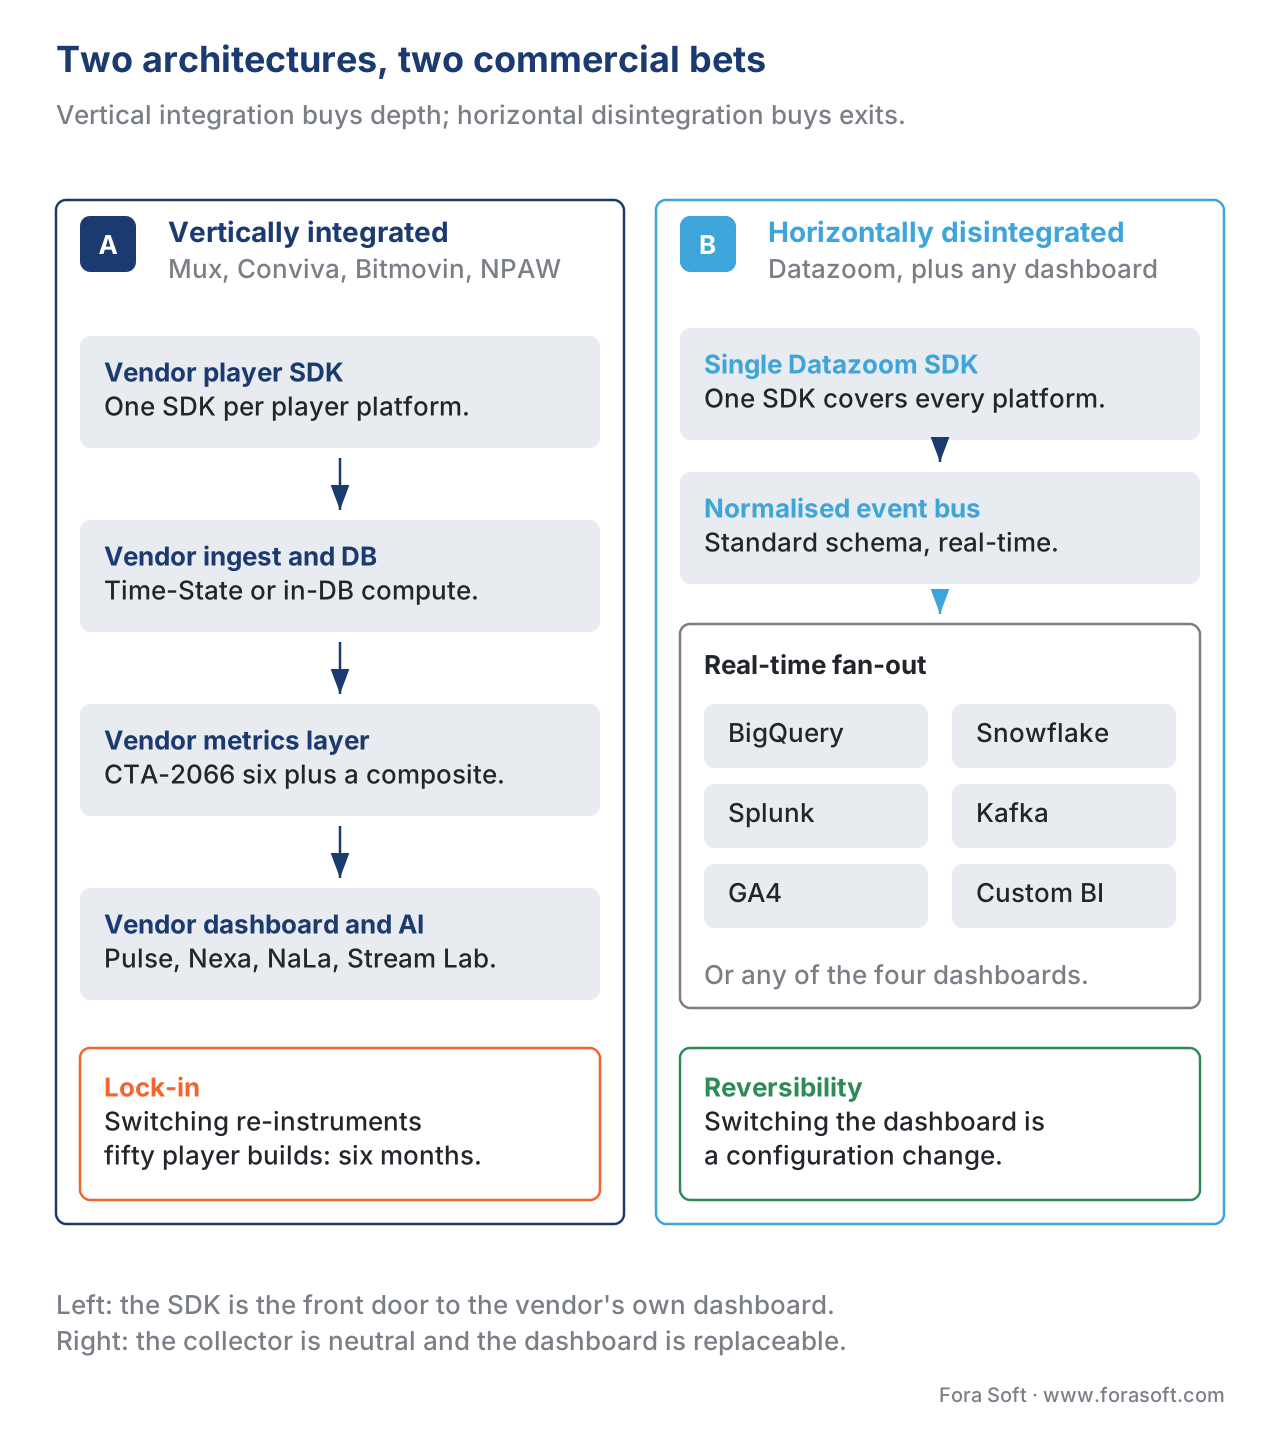 Figure 3. Two architectures, two commercial bets. Vertical integration buys depth and locks you in; horizontal disintegration buys flexibility and asks you to assemble the dashboard yourself.
Decision Tree: Which Vendor Wins Your Slot
A clean way to use the matrix above is to walk a decision tree. The four questions below sequence in roughly the order they show up in a real vendor selection.
Question one: do you already run a serious data warehouse, and is "vendor-neutral data ownership" non-negotiable? If yes, Datazoom is the foundation; the dashboard is a downstream decision. If no, Datazoom is over-engineering; pick from the four dashboards.
Question two: are you running the Bitmovin Player today, or planning to? If yes, Bitmovin Analytics is the highest-leverage pick — you get player-internal state none of the others can see, and the bundling discount eases the price. If no, Bitmovin's advantage shrinks and the field is open.
Question three: at your traffic scale, will the analytics bill consume more than 1% of streaming revenue per year? If yes, you are likely in tier-1 territory, and the right shortlist is Conviva and NPAW — both built for the depth and the scale, with NPAW typically pricing 20–40% lower than Conviva for the same volume. If no, you are likely better served by Mux Data — the developer experience and the price will repay the trade-off in dashboard breadth.
Question four: is your operations centre EMEA-based, and is a non-U.S. vendor a procurement preference? If yes, NPAW jumps ahead of Conviva on local presence and on the support relationship; in U.S.-headquartered procurement, the same factor flips Conviva back to the front. None of the five vendors should be picked on flag alone, but procurement realities are real.
A reasonable shortlist after one pass through that tree is two vendors, not five. A reasonable RFP is four to six weeks of trial integration, not a year of feature debates.
Common Mistake: Picking the Vendor Before Picking the Metric
The single most expensive failure in a vendor selection is the one nobody owns up to until the contract is signed: the operator picks the vendor before picking the metric definitions that the vendor will be measured by. Three weeks after go-live, the head of engineering looks at the dashboard, looks at the contract, and discovers the vendor's "Rebuffering Ratio" is a session-weighted ratio while the contract was written against a viewer-weighted one — and the dashboard makes the service look 30% better than the engineering team's homegrown logs say it is. The vendor is not lying; both definitions are valid; the operator did not specify which one it wanted.
Avoid this by writing the metric definitions first, in the language of CTA-2066, with the aggregation rule (session-weighted vs viewer-weighted, p50 vs p95 vs mean, exclude-EBVS-under-1s yes or no) explicitly stated. Then ask each vendor in the shortlist to show, in a trial deployment, the same metric computed against the same player sessions. The variance across vendors on a well-defined metric is small; the variance across vendors on a poorly-defined metric is enough to make the comparison meaningless. The full set of CTA-2066-aligned KPI definitions used in the article above, including the aggregation rules and the thresholds, ships as a one-page reference at the end of QoE Metrics: What Every Dashboard Should Show — start from that one-pager, not from a vendor's marketing page.
How CMCD v2 Is Reshaping the Category in 2026
The single largest structural change in streaming analytics over the eighteen months ending May 2026 is the publication of CMCD v2 (CTA-5004-A) in February 2026 and its rapid adoption across the major player ecosystems — AVPlayer, ExoPlayer, hls.js, Shaka, dash.js, Video.js v10, and the Bitmovin Player all support CMCD v2 collection by mid-2026. DVB folded CMCD into the DVB-DASH specification on the back of requirements approved in Q2 2024.
CMCD v2 changes the analytics-vendor business model in two ways. First, it commoditises a significant fraction of the SDK's value — many of the events a third-party SDK had to detect through indirect signals are now first-class fields the player exposes natively. The vendors that lean into this and build their dashboards on top of CMCD v2 fields (Mux, Bitmovin) get a free integration win on every player that already supports CMCD; the vendors that hold their own SDK as the moat (Conviva, NPAW) defend the position by arguing — correctly — that CMCD v2 still does not cover every signal an operator needs.
Second, CMCD v2 erodes the wall between analytics and CDN observability. A CDN that consumes CMCD v2 (Akamai, Cloudflare, Fastly, AWS CloudFront have all shipped CMCD-aware ingestion) can correlate player-side rebuffering against CDN-side cache state without an analytics-vendor SDK in the loop at all. By 2027, expect the CDN dashboards to colonise the bottom half of the metrics stack — first-byte time, segment cache-hit ratio, rendition-switch counts — and the analytics vendors to retrench upward, toward business-outcome metrics, AI-driven incident response, and the warehouse-integration story.
The strategic takeaway for an operator in 2026 is to plan for a hybrid analytics stack: CMCD v2 on every player, CDN observability for the lower-layer signals, a dashboard vendor (Mux / Conviva / Bitmovin / NPAW) for the QoE composite scores and the incident-response surface, and increasingly, a Datazoom-style data layer underneath if the company expects to outlive any single vendor relationship.
 Figure 4. Twenty years of streaming-analytics history fit on one timeline, and the standards events are doing more shaping than the vendor announcements.
Three Production Traps Every Operator Hits
Trap one: paying for views you do not watch. Every analytics vendor in this article charges by the play, the impression, or the event. The bot, the crawler, the autoplay carousel that the user scrolled past in under one second — they all count by default. Conviva, Mux, and Bitmovin have configurable filters; the operator has to set them, and the operator has to verify the bill against the filtered count. Skipping that step typically costs 10–30% of the bill, year over year.
Trap two: trusting a single composite score. Conviva's SPI, Mux's Viewer Experience Score, Bitmovin's QoE Score, and NPAW's Happiness Score are all useful — and they are all opinions. Each vendor weights the six CTA-2066 metrics differently, and the same incident can move one vendor's composite by 5 points and another's by 25. Treat the composite as a trigger for investigation, never as the answer to "did the service do well today". The six underlying metrics are the answer; the composite is the alarm.
Trap three: scoping the integration too narrowly. Operators that integrate the analytics SDK only on web sessions get a dashboard that is silent about iOS, Android, Roku, and the smart-TV long tail — which is exactly where the worst-tail problems live. The cost of integrating on every platform is real, but it is paid once; the cost of debugging a Tizen-only rebuffering surge without telemetry is paid every incident.
Free download: Streaming Analytics Vendor ScorecardOne page: the twelve criteria that actually differ, the five vendors scored against each, the annual bill at 60 M plays a month, and the four decision-tree questions to run before the first demo.Where Fora Soft Fits In
Fora Soft has built video products since 2005 — 239+ shipped projects across video conferencing, video streaming, OTT and Internet TV, video surveillance, e-learning, telemedicine, and AR/VR. We have integrated every vendor on this list at customer scale, from Mux Data inside a 50-player web app to Conviva inside a global live-sports back end, and we have built the Datazoom-style vendor-neutral collection layer for clients who refused to lock their player fleet to any single dashboard. When a client asks us which one to pick, we walk the decision tree above with their numbers in hand; the answer changes between clients, and the answer changes for the same client as it grows. Our video streaming software development team wires the chosen QoE SDK into every player and pipes its events into the client's own warehouse, and on OTT and Internet TV platforms we build the dashboards that tie rebuffering and startup time to churn.

The book
Video Streaming: A Complete Guide to Video Delivery — From ABR and CDNs to Players, WebRTC, DRM, and the Economics of Streaming
A vendor selection goes well when you already know what the dashboard is going to measure. Volume 3 of the Fora Soft Video Engineering Handbook covers the layers these five platforms report on — ABR rung selection, CDN and cache behaviour, player recovery, QoE monitoring — and the delivery economics that decide whether a $400,000 analytics contract is cheap or absurd at your volume. Read its QoE-monitoring and cost chapters before you sit down with the shortlist. Written by Nikolay Sapunov, CEO at Fora Soft.
Running a vendor selection and want the shortlist down to two?
Send us your player fleet, your monthly plays and the metric definitions you are willing to sign, and we will walk the decision tree with your numbers and tell you what the trial integration will cost. 250+ video products shipped since 2005.
See our case studies
Case study
Worldcast Live
HD concerts at 0.4–0.5 s glass-to-glass for 10,000 simultaneous viewers at 1.5 Gb/s. When a five-minute incident lands mid-show, the analytics bill stops being the expensive number.
Case study
Sprii
72,000+ live shopping events across web, iOS and Android for 3,000+ brands. This is trap three in practice: instrument the web only and the dashboard goes silent where the money is.
Case study
Speed.Space
Remote production at 1080p and 8 Mbps for Netflix, Electronic Arts and HBO. Picture quality is contractual here, so the metric definition has to be agreed before any vendor reports against it.
What to read next
Metrics
QoE Metrics: What Every Dashboard Should Show
Write the metric definitions first. This is the one-pager the vendors get measured against.
Observability
Player Observability and the Metrics That Ship in Production
What the player has to emit before any of these five platforms can count it.
Players
Smart TV Players: Tizen, webOS, Roku, Android TV, Fire TV, Vidaa
The device long tail that decides whether an SDK breadth column matters to you.
Economics
Cost Economics of a Streaming Product: A Worked Model
Put the analytics bill next to the CDN, encoding and DRM lines before you defend it.
References
- Consumer Technology Association. CTA-2066: Streaming Quality of Experience Events, Properties and Metrics. October 2020. <https://shop.cta.tech/products/cta-2066>. Public mirror of normative text on GitHub: <https://github.com/mlevine84/CTA-2066_Public_Version>. The controlling specification for every metric definition this article references. Standards tier 1.
- Consumer Technology Association. CTA-5004-A: Common Media Client Data (CMCD) v2. Published February 2026. <https://cdn.cta.tech/cta/media/media/resources/standards/pdfs/cta-5004-final.pdf> (v1 final); v2 working repository: <https://github.com/cta-wave/common-media-client-data>. The 2026 standards shift this article centres its market-evolution argument on. Standards tier 1.
- Streaming Video Technology Alliance, Measurement / QoE Working Group. Key Network Delivery Metrics. <https://wiki.svta.org/key-network-delivery-metrics/> and <https://www.svta.org/working-group/measurement-qoe/>. Working-group reference for QoE-vs-QoS framing and the metric-definition discipline this article recommends. Standards tier 1.
- IETF. RFC 9317: Operational Considerations for Streaming Media. October 2022. <https://datatracker.ietf.org/doc/rfc9317/>. The IETF reference frame for how streaming-media operations relate to the lower-layer transport metrics analytics dashboards report. Standards tier 1.
- Mux. Video Performance Analytics and QoE monitoring | Mux Data. <https://data.mux.com/>; Mux Data pricing: <https://www.mux.com/pricing/data>; SDK integration guides: <https://www.mux.com/docs/guides/monitor-exoplayer>, <https://www.mux.com/docs/guides/monitor-roku>; Extend Data with custom metadata: <https://www.mux.com/docs/guides/extend-data-with-custom-metadata>. Vendor-primary source for the Mux Data positioning, pricing, and SDK breadth claims. Vendor tier 3.
- Conviva. Conviva Operational Data Platform for Streaming Platforms. <https://www.conviva.ai/streaming-platforms/>; Conviva Video Streaming Insights: <https://www.conviva.ai/video-streaming-insights/>; SPI Introduction: <https://docs.conviva.com/learning-center-files/content/ei_application/ea-features/spi_intro.htm>; Conviva Overview: <https://docs.conviva.com/learning-center-files/content/main/conviva_overview.htm>. Vendor-primary source for the Conviva architecture, AI-surface, and SPI metric claims. Vendor tier 3.
- Bitmovin. Observability Analytics for QoS and QoE: <https://bitmovin.com/video-observability-analytics/>; Bitmovin Pricing: <https://bitmovin.com/pricing>; Stream Lab MCP Server announcement (CES 2026): <https://www.sportsvideo.org/2025/12/19/bitmovin-launches-stream-lab-mcp-server-ahead-of-ces-2026/>. Vendor-primary source for the Bitmovin Analytics scope, pricing tiers, and 2026 MCP roadmap claims. Vendor tier 3.
- NPAW. NPAW – The global video intelligence company: <https://npaw.com/>; Company page: <https://npaw.com/company/>; Video QoS & QoE: <https://npaw.com/solutions/video-qos-qoe/>. Vendor-primary source for the NPAW product modules, NaLa AI Assistant, and market-positioning claims. Vendor tier 3.
- Datazoom. Datazoom — the video data platform: <https://www.datazoom.io/>; Beyond Video: Datazoom is Now Your Platform for the Total User Journey (November 2025 Base Collector announcement): <https://www.datazoom.io/product-releases/beyond-video-datazoom-is-now-your-platform-for-the-total-user-journey>. Vendor-primary source for the Datazoom data-layer model and the 2025 platform expansion. Vendor tier 3.
- Visual Hood. Compare video analytics tools for streaming: OTT, Live, VOD. <https://vhd.me/compare-video-analytics-tools-streaming/>. Independent comparison incorporating OTT-operator survey share figures (Conviva 16%, Bitmovin 13%, NPAW 11%, Mux 6%, other 24%) referenced in the Market Position discussion. Industry tier 4.
