


Why This Matters
A streaming product loses money in two different shapes. The first shape is a slow leak — a 1% rebuffer ratio that climbs to 2.4% over six weeks while nobody notices, eroding watch time and renewal rates one percentage point at a time. The second shape is a cliff — the manifest stops advancing, the player throws MEDIA_ERR_NETWORK, and half a million concurrent viewers see a black rectangle inside the same fifteen-second window. Both shapes are incidents; both shapes deserve a response. The slow leak gets caught by your Service Level Objectives (the targets your team commits to, abbreviated SLO) and the dashboards that watch them; the cliff gets caught by your alerting and your runbook. This article is about the cliff — the playbook a streaming team executes when something is on fire and a human has to make decisions inside the next two minutes.
The audience is the person who carries the pager. A product manager or operations lead reading this should leave with a clear picture of what a healthy incident-response practice looks like and how to scope one for a streaming team — what roles to staff, what severity rules to write down, what to put on the wall. A senior streaming engineer should leave with the seven-step triage runbook, the seven dashboards every war room needs, and the post-incident artefacts that turn a one-time fire into a permanent fix.
What an Incident Is, Precisely
The first job of an incident-response practice is to agree what an incident is. Without a written definition, every responder makes the call themselves, and you end up paging four engineers for a 0.3-point bump in rebuffer ratio while letting a 7%-startup-failure regression sit in the dashboards for a weekend.
A streaming incident is any sustained deviation from a published Service Level Objective (SLO) that the user can feel. "Sustained" is part of the definition — a fifteen-second blip is noise, not an incident. "Published" is part of the definition — if you have not written down what the target is, you have no basis to declare a miss. "The user can feel" is the most important part — internal CPU spikes that never reach a viewer are operations work, not incidents.
The three SLOs that drive almost every streaming incident are the ones the Consumer Technology Association codified in CTA-2066, the 2024 standard that aligns the analytics vendors on what to call each metric and how to compute it: availability (video starts succeed when the user clicks play), continuity (playback does not stall), and video and audio quality (bitrate and decoder errors). Translate those three into four production metrics and you get the alert surface every modern streaming team runs on: video start failure rate, exits before video start, rebuffer ratio, and average bitrate / picture quality. When any of those four breaks its SLO band for more than the published evaluation window — typically one to five minutes — the alert fires and an incident exists.
The Mux engineering team publishes a practical alert threshold that has become an industry default: page the on-call when the share of concurrent viewers currently rebuffering exceeds 5%, investigate when it crosses 3%, and treat anything above 1% as a backlog item for the next sprint. The thresholds are not magic — they are anchored to research showing that audience abandonment climbs sharply once rebuffer ratio crosses about 3% — but they are a reasonable default to start from on day one and tune from there.
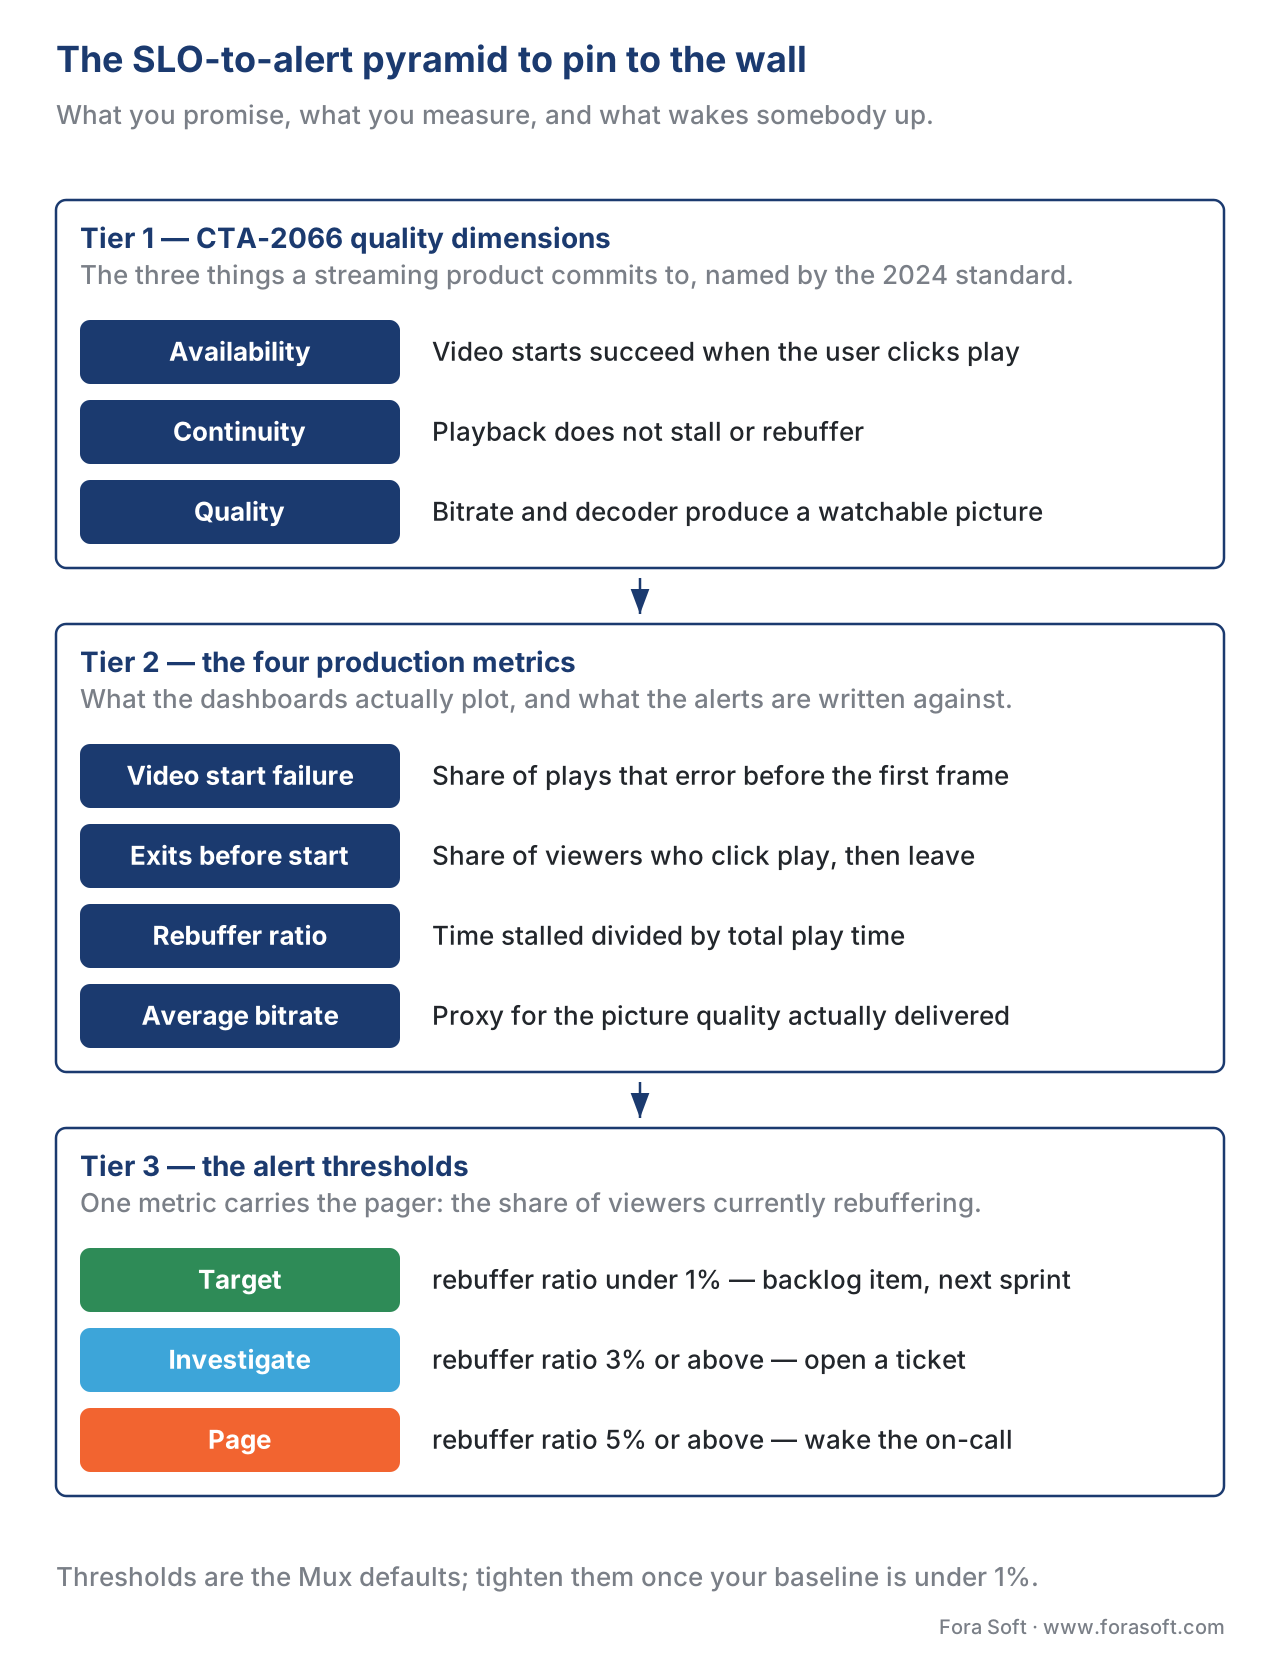 Figure 1. The SLO-to-alert pyramid every streaming team should pin to the wall. The thresholds are the Mux defaults; teams routinely tighten the alert threshold once their baseline drops below 1% rebuffer ratio.
Severity Levels: SEV1 to SEV4
Once an alert fires, the on-call has thirty seconds to classify the incident. The classification drives everything that follows — who gets paged next, how aggressively the team mitigates, whether the executive group gets a status email, whether the on-call wakes up the legal counsel for a contractual SLA breach. Get the severity wrong and you either over-spend on a minor blip or under-staff a customer-visible outage.
The severity grid below is the one most large streaming teams converge on. The names follow the industry convention PagerDuty popularised in 2017 and incident.io codified in 2024; the content is streaming-specific.
| Severity | Trigger | Examples | Response |
|---|---|---|---|
| SEV1 | Global outage or core feature broken with no workaround. >25% of viewers cannot start a stream, OR rebuffer ratio >15% globally for >2 min. | Origin cluster down. DRM license server unreachable. Manifest server returns 5xx for >50% of requests. Top-of-funnel signup flow broken. | Page on-call, manager, and Incident Commander immediately. Wake people up. Public status page within 15 min. Executive bridge within 30 min. |
| SEV2 | Major degradation with workaround OR regional outage. >5% of viewers affected. Single region/CDN/device class broken. | One of two CDNs failing. iOS app crashing on launch. Specific DRM (e.g. PlayReady on Tizen) failing. Live stream stuck on a single content channel. | Page on-call and manager during business hours; page on-call only after-hours. Status page within 30 min. |
| SEV3 | Localised or partial degradation. <5% of viewers affected. Workaround obvious. | One ad creative consistently triggering player errors. One CDN POP misbehaving. Captions missing on a single VOD title. | Page on-call during business hours; ticket for next morning after-hours. Internal Slack channel only. |
| SEV4 | Minor anomaly, dashboard-visible but not user-visible. | 0.4-point creep in average startup time over a week. Increase in cache miss rate at a single edge. Sporadic 4xx errors on a non-critical endpoint. | Ticket. Address in next sprint. |
Roles: Who Is in the War Room
A streaming incident in production rarely has one cause. The manifest stopped advancing because the packager paused because the encoder dropped a key frame because the contribution link saturated because the stadium Wi-Fi handed the encoder off to a slower access point. Tracing that chain requires every owner in the chain to be present and coordinated. The structure that scales is borrowed almost verbatim from emergency services and Netflix's published practice: a modified Incident Command System (ICS) with four named roles.
The Incident Commander (IC) owns the incident, not the fix. The IC's job is to keep the response coordinated, decide when to mitigate versus when to investigate, escalate when scope grows, and call the incident over. The IC does not type commands or debug code; the moment they reach for a terminal, the incident loses its commander. On large streaming teams the IC is a rotating, on-call role separate from the engineering on-call.
The Communication Lead (Comms) owns the status page, the customer-support FAQ updates, the executive bridge, and the post-incident customer email. In a SEV1, Comms is publishing a public status update every fifteen to thirty minutes whether or not there is new information; an unupdated status page is, by itself, a reason for customers to churn.
The Operations Lead (Ops) is the senior engineer driving the technical investigation. Ops opens dashboards, runs commands, decides which mitigation to try first, and pulls in subject-matter experts as needed. In smaller teams the on-call and Ops are the same person; once the team grows past about ten engineers, splitting them prevents the on-call from being interrupted by status questions while debugging.
Subject Matter Experts (SMEs) are pulled in by Ops as the incident scope clarifies. A live-stream outage might pull in the encoder owner, the packager owner, the CDN account engineer (often a vendor employee), the DRM specialist, and the player engineer on the affected device class. The IC is responsible for pulling SMEs in and, just as important, releasing them once their part is resolved — engineers loitering in the war room with nothing to do is how an incident drifts.
The fifth person, often forgotten, is the scribe — somebody whose only job is to write down what is being decided in the incident channel timestamped to the minute. The scribe's notes are what makes a post-incident review honest. Modern incident-management tools (FireHydrant, Rootly, incident.io) automate most scribe duties, but somebody still has to confirm the auto-captured timeline matches reality before it ships in the post-mortem.
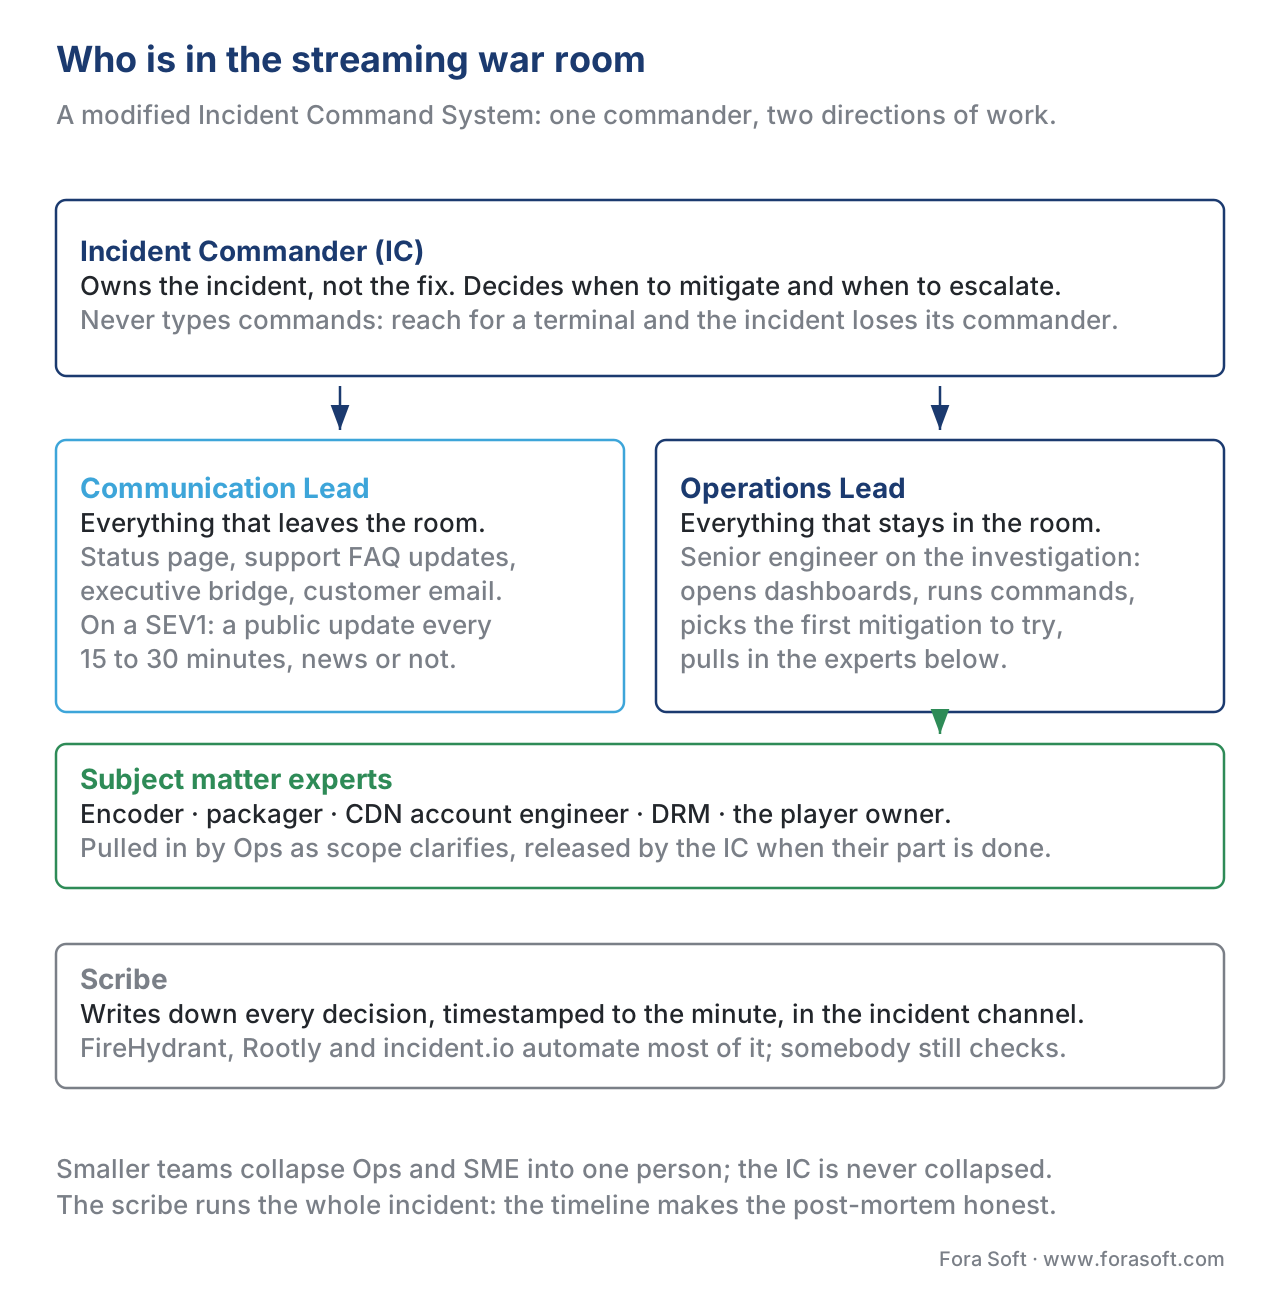 Figure 2. The five named roles that keep a streaming incident from devolving into a group chat. Smaller teams collapse Ops and SME into one person; the IC role is never collapsed into anything else.
The Seven-Step Triage Runbook
When the pager fires, every streaming on-call should follow the same seven steps, in the same order, regardless of what the alert claims is broken. The sequence is borrowed from the inverted-pyramid model the AWS Streaming Media Lens recommends in its Failure Management chapter: confirm scope first, assess impact second, mitigate third, find root cause fourth. Speed comes from running the steps in order, not from skipping them.
Step 1 — Confirm the alert is real. Open the dashboard the alert is sourced from. Are users actually rebuffering, or did the analytics SDK emit a burst of events because a CDN POP returned a malformed Cache-Control header? Cross-check with one independent source — Mux Data plus Conviva, or your own player-emitted CMCD telemetry plus the CDN logs. False alerts get acknowledged and closed without escalation; about 10–20% of pages in a mature streaming team turn out to be alert tuning issues rather than incidents.
Step 2 — Scope the impact. Three questions: how many viewers, which regions, which device classes. A regional CDN failure looks the same on a global dashboard as a global manifest server outage; the difference shows up only when you slice by country and ASN. Modern analytics platforms (Conviva, Mux, Bitmovin, NPAW) all offer the same slice in the same place — open it before opening anything else.
Step 3 — Classify and announce. Pick a severity. Open an incident channel in Slack or Teams. Page the IC if SEV1 or SEV2. Post a status-page placeholder ("We are investigating elevated playback errors in EMEA — updates every 30 min") within fifteen minutes of declaration. The placeholder buys you the time to investigate without a customer-support flood.
Step 4 — Check the seven dashboards. Every streaming team should keep seven dashboards bookmarked in the same order, because the cause of 95% of incidents lives in one of seven places:
- Origin health — segment 5xx rate, segment generation latency, manifest age in seconds since last update. If manifest age stops advancing, the live stream has stalled at the origin.
- Packager health — chunk-encoding latency, CMAF chunk gaps, audio/video timestamp drift.
- CDN edge health — per-POP cache miss rate, per-POP 5xx rate, per-POP origin pull rate. A misbehaving POP is the most common single cause of a regional incident.
- Manifest validity — does the current manifest parse? Does it advance? Are the segment URLs reachable from outside your network?
- DRM license server — license issuance rate, license server response latency, per-DRM (Widevine / FairPlay / PlayReady) error rate.
- Player error code distribution — what error is the player actually throwing, on what platform, in what version, on what ISP?
- ISP and CDN correlation — does the regression line up to a specific ISP or peering point? Conviva, Mux, and NPAW all surface this slice; without it, an ISP-side problem looks identical to a CDN-side problem and you waste twenty minutes paging the wrong vendor.
Step 5 — Mitigate. The decision to mitigate before knowing the root cause is the single hardest call in incident response, and the IC owns it. The bias should be aggressive: in streaming, the cost of a mitigation that turns out to be unnecessary (an extra five minutes of failover traffic on the secondary CDN) is almost always lower than the cost of an extra five minutes of black screen for the user. The four mitigations every streaming runbook should script are: shift traffic to the secondary CDN (via DNS or content steering), roll back the most recent deploy (encoder, packager, or player), switch to a backup live origin pipeline (the redundant ingest path), and disable the offending feature flag (the ad pod that started failing, the new DRM license server, the canary player build). Mitigation should be one command, not a five-step procedure, and that command should be documented in the runbook and rehearsed in chaos-engineering drills.
Step 6 — Find root cause. Once the bleeding has stopped, the team has time to investigate properly. The order: timeline (what changed in the last six hours?), correlate (which subsystem's metric moved first?), reproduce (can we make a test stream do the same thing?), and confirm (does the fix resolve the metric, or just mask it?). The single most common root cause in 2026 streaming incidents is a configuration change that was not tested at the scale or in the region where it eventually broke — which is why a sixty-minute window of "what shipped today?" is the first thing every runbook looks at.
Step 7 — Resolve and close. The IC declares the incident over once metrics return to SLO for a sustained window (typically thirty minutes) and the team has confirmed the fix is the fix. The status page goes to "Resolved". A post-incident review is scheduled within five business days. The on-call hands off cleanly — including any temporary mitigations that need to be reversed once the underlying cause is fixed.
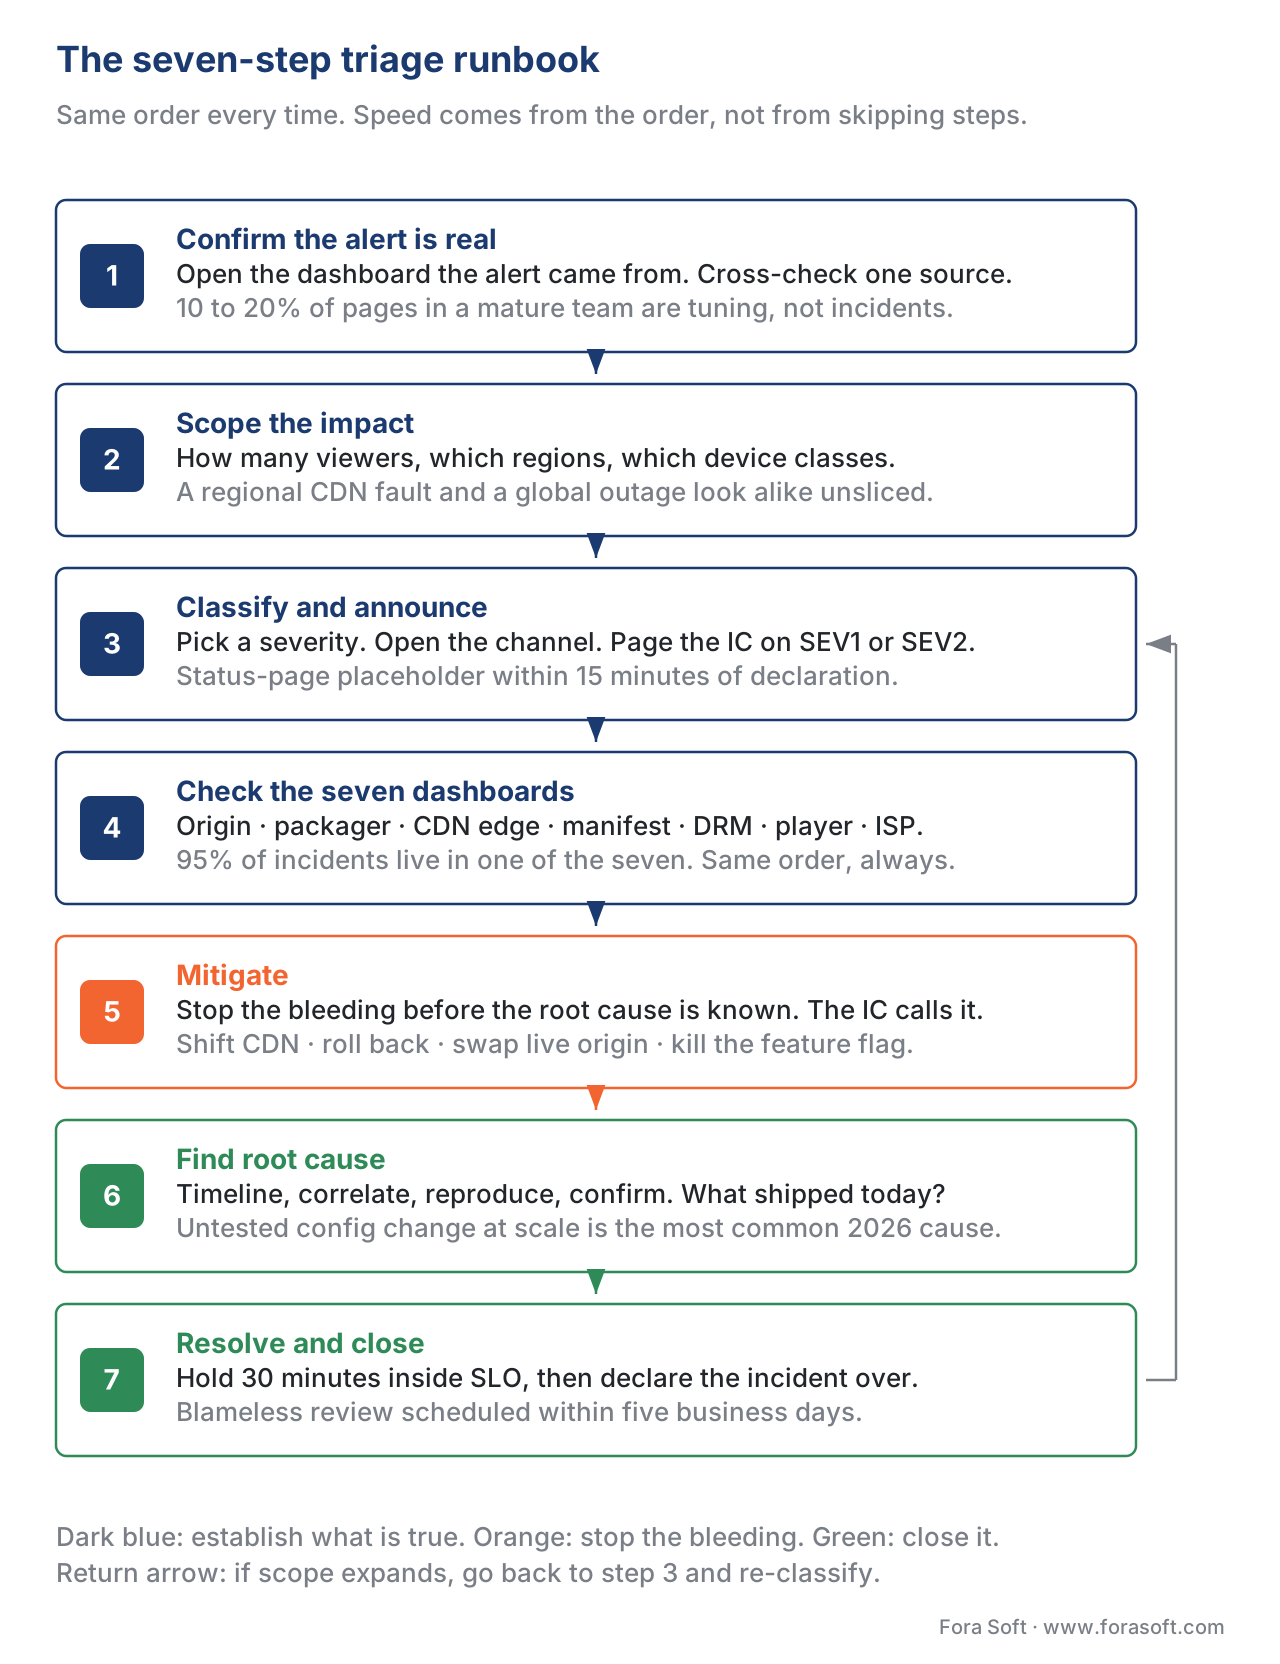 Figure 3. The seven-step runbook every streaming on-call should follow in the same order every time. Speed comes from the order, not from skipping the early steps.
A Worked Example: The 14-Minute SEV1
Numbers help. Consider a hypothetical mid-market live-streaming platform with 800,000 concurrent viewers across North America and Europe, two CDNs (one primary, one secondary on standby with content steering), a single live origin region with a hot standby, and a baseline rebuffer ratio of 0.7%.
At 19:43 UTC on a Saturday, an alert fires: rebuffer ratio in EMEA crosses 5.2% and is rising at one point per minute. Video start failure rate in EMEA is unchanged; the issue affects active streams only. The on-call acknowledges the page at 19:43:40.
By 19:45, the on-call has opened the analytics dashboard and confirmed the alert is real. EMEA rebuffer ratio is now 6.8%; North America is unchanged at 0.7%. The on-call declares SEV2 (>5% of viewers affected, regional, workaround possible) and opens the incident channel.
By 19:47, the IC has joined the channel and the seven dashboards have been opened. Origin health is fine. Packager health is fine. CDN edge health shows a 4× spike in cache miss rate at three POPs in Frankfurt, Amsterdam, and Paris on the primary CDN. Manifest validity is fine. DRM is fine. Player error distribution shows no change. ISP/CDN correlation shows the regression is concentrated on the primary CDN; viewers being steered to the secondary are unaffected.
At 19:49, the IC makes the mitigation call: shift all EMEA traffic from the primary CDN to the secondary via the content-steering service. The Ops lead executes the command. The change propagates to the player population within 60 seconds. By 19:52, rebuffer ratio in EMEA is trending back down toward baseline.
By 19:54, rebuffer ratio is at 1.1% in EMEA. The Comms lead has posted three status-page updates. The IC announces a SLO-recovery hold: thirty minutes of below-1.2% rebuffer in EMEA before declaring the incident resolved.
At 20:24, the IC declares the incident resolved. Total wall-clock duration from page to resolution: 41 minutes, with 14 minutes between page and material customer-impact reduction. The primary CDN's account engineer joins the post-incident review on Tuesday morning and confirms the cause: a misconfigured shield-tier deploy at the primary CDN's EMEA region, rolled back twenty minutes after the steering shift.
Three lessons from the worked example. First, the team mitigated before knowing the root cause; the customer-impact reduction came at minute 14, the root cause arrived three days later, and that order is correct. Second, the seven-dashboard pass found the cause-region within four minutes; the runbook structure paid off. Third, the post-incident review fixed the underlying CDN configuration drift, not just the symptom — because the team had multi-CDN steering already wired up, the symptom was a 14-minute SEV2 rather than a 90-minute SEV1.
The Pitfalls
Five mistakes show up in almost every streaming incident review in the first year of a new product.
The on-call types instead of commands. A junior on-call without a runbook will start ssh-ing into boxes within ninety seconds of being paged. They lose the scope step, the impact step, the announce step, and they almost always page the wrong vendor first. The fix is the runbook, rehearsed monthly.
The team mitigates and forgets. Mitigation hides the root cause. A team that survives an incident by failing over to the secondary CDN and then never investigates why the primary failed will eventually fail over to the secondary while the primary is still being used as the failback target, and the second incident will be twice as long. Every mitigation must end with a follow-up ticket and a calendar deadline.
The status page lies by omission. Customers tolerate honest outages; they do not tolerate silent outages. A status page that still says "All systems operational" forty minutes into a public Twitter storm is a churn accelerator. The rule is simple: if SEV1 or SEV2, the status page acknowledges the incident within 15 minutes of declaration, even if the message is "We are investigating".
The post-incident review names a person. Blameful post-mortems destroy the next incident. If the engineer who pushed the broken deploy fears being publicly blamed, they will hide the next incident, and the next incident will be worse. Modern SRE practice — the version Google codified in Site Reliability Engineering and the streaming industry borrowed wholesale — is blameless: the question is never "who broke production" but "what process let this break production". The named action items are about process, tooling, and tests, never about people.
The alert thresholds drift. A team that sets a 5% rebuffer-ratio page threshold on day one and never tunes it will be paged every weekend for three years. Every alert needs an audit cycle: ask, every ninety days, "has this alert fired in the last ninety days? was it actionable when it did?" Alerts that fail both questions get tuned, demoted, or deleted. Alerts that fired but were not actionable are the most damaging — they teach the on-call to ignore the pager.
Tools: The 2026 Stack
A modern streaming SRE practice runs on a small, stable stack:
- Metrics and dashboards: Grafana plus Prometheus on the infrastructure side; Conviva, Mux Data, Bitmovin Analytics, or NPAW on the streaming-experience side. (See our analytics-platform comparison for picking between the four.)
- Alerting and paging: PagerDuty or Grafana OnCall (now Grafana Cloud IRM since the 2024 merger). incident.io, FireHydrant, Rootly, and Squadcast are credible alternatives.
- Incident coordination: A dedicated Slack or Teams channel per incident, auto-created by the incident-management tool. The tool also provisions the timeline scribe, the role assignments, and the post-mortem template.
- Status page: Statuspage (Atlassian), Better Stack, or Instatus. Whichever the team picks, the requirement is the same: a Comms lead can post an update in under thirty seconds.
- Runbook automation: Rundeck, Ansible, or the runbook-as-code features in the incident-management tool. Critically — runbook automation in 2026 has matured past bash scripts to intelligent runbook execution, context-aware human-in-the-loop workflows that coordinate people, tools, and communications. The shift to look for in your tool selection is whether the runbook is a static document (likely already obsolete) or version-controlled, executable code reviewed in the same pull-request flow as the rest of the infrastructure.
The single most leveraged investment a streaming team can make in its first year is chaos engineering — Netflix's Chaos Monkey, Latency Monkey, and Chaos Kong, or the modern equivalents from Gremlin and AWS Fault Injection Service. The discipline forces the team to rehearse the runbook against simulated origin failures, simulated CDN outages, simulated DRM license-server timeouts. The team that runs a chaos drill every two weeks has a runbook that works on the day of the real incident; the team that does not, does not.
Free download: Incident Response RunbookOne A4 page for the wall: the seven-step triage order, the SEV1–SEV4 grid with its streaming triggers, the seven dashboards to open, and the four mitigations that should each be one command.Where Fora Soft Fits In
Fora Soft has scoped, built, and operated incident-response practices for live-streaming, video-conferencing, telemedicine, e-learning, OTT, and surveillance platforms since 2005. Across 239+ shipped projects, the constant has been the same: the playbook is more valuable than any single tool the team picks. Our streaming engineers help product teams stand up the seven-dashboard layout against their chosen analytics vendor, write the runbook in the language their on-call already speaks, and run the first three chaos drills end to end. The point of the engagement is to leave the team confident that the next 19:43 UTC alert finds a calm war room and a working runbook — not a scramble. If you want that discipline built into the platform itself, our streaming software maintenance and support team runs monitoring, releases and on-call for live products, and our video streaming development engineers fix the root causes the post-mortems surface.
The book
Video Streaming: A Complete Guide to Video Delivery — From ABR and CDNs to Players, WebRTC, DRM, and the Economics of Streaming
A runbook is only as good as the engineer's model of the thing that broke. Volume 3 of the Fora Soft Video Engineering Handbook walks the layers the seven dashboards watch — CDN and cache behaviour, origin shielding, ABR rung selection, player recovery, DRM licence paths and QoE monitoring — so the 19:43 page lands on somebody who already knows where a 4× cache-miss spike at three POPs comes from. Written by Nikolay Sapunov, CEO at Fora Soft.
Who picks up the pager on your product tonight?
Send us your analytics stack, your severity grid if you have one, and the mitigations you can run in a single command, and we will tell you which of the seven dashboards you are missing and what the first chaos drill should break. 250+ video products shipped since 2005.
See our case studies
Case study
Worldcast Live
HD concerts at 0.4–0.5 s glass-to-glass for 10,000 simultaneous viewers at 1.5 Gb/s. A show has no maintenance window: mitigate first, find the root cause on Tuesday.
Case study
Sprii
72,000+ live shopping events for 3,000+ brands across web, iOS and Android. Step 2 of the runbook is the whole job here — a global dashboard hides a single broken device class.
Case study
Speed.Space
Remote production at 1080p and 8 Mbps for Netflix, Electronic Arts and HBO. When picture quality is contractual, the severity grid has to be written before the first incident.
What to read next
Metrics
QoE Metrics: What Every Dashboard Should Show
The metric definitions the thresholds in this article are written against.
Analytics
Analytics Platforms: Mux Data, Conviva, Bitmovin, Datazoom, NPAW
The surface the war room stares at, and what it costs to slice by ISP and ASN.
CDN
Multi-CDN: The Architecture, the Cost Story, the Failure Modes
The failover the 14-minute worked example assumed was already wired up.
Observability
Player Observability and the Metrics That Ship in Production
What the player has to emit before step 1 can confirm anything.
References
- CTA-2066: Streaming Quality of Experience Events, Properties and Metrics — Consumer Technology Association, public-comment final, 2024. The standard the four production metrics in §2 map back to. Available at https://shop.cta.tech/products/streaming-quality-of-experience-events-properties-and-metrics and the open public version at github.com/cta-wave/R4WG20-QoE-Metrics. Accessed 2026-05-26. (Tier 1 — standards body.)
- AWS Streaming Media Lens — Failure Management — AWS Well-Architected Framework, 2024 edition. The inverted-pyramid response model the seven-step runbook in §5 adapts. https://docs.aws.amazon.com/wellarchitected/latest/streaming-media-lens/failure-management.html. Accessed 2026-05-26. (Tier 3 — first-party engineering blog from spec contributors.)
- Google Site Reliability Engineering Workbook — Incident Response and Error Budget Policy chapters — Google, 2018 first edition with continuous updates. The role separation (IC / Ops / Comms / SME), the blameless post-mortem doctrine, and the error budget bands referenced in §3 and §6. https://sre.google/workbook/incident-response/ and https://sre.google/workbook/error-budget-policy/. Accessed 2026-05-26. (Tier 4 — vendor engineering blog at the practice's origin.)
- PagerDuty Incident Response — Severity Levels and Incident Commander training — PagerDuty, continuously updated. The severity definitions and IC role description in §3 and §4 are aligned to the PagerDuty taxonomy that has become the industry default. https://response.pagerduty.com/before/severity_levels/ and https://response.pagerduty.com/training/incident_commander/. Accessed 2026-05-26. (Tier 4 — vendor primary source.)
- Mux — Live Streaming Analytics: The Metrics That Actually Matter — Mux engineering blog. The 5%, 3%, and 1% rebuffer-ratio thresholds in §2. https://www.mux.com/articles/live-streaming-analytics-the-metrics-that-actually-matter. Accessed 2026-05-26. (Tier 4 — vendor engineering blog.)
- Netflix TechBlog — Netflix Live Origin — Liu, Lynch, Newton. December 2025. Reference for the live-origin failover model the worked example draws on. https://netflixtechblog.com/netflix-live-origin-41f1b0ad5371. Accessed 2026-05-26. (Tier 3 — first-party engineering blog.)
- Conviva — OTT 101: Top 5 Metrics That Matter for Tech Ops and Streaming Performance Index documentation. The Streaming Performance Index (SPI) composite metric and per-cohort benchmarking referenced in §2. https://www.conviva.com/ott-101-top-5-metrics-that-matter-for-tech-ops/ and https://docs.conviva.com/learning-center-files/content/ei_application/ea-features/spi_intro.htm. Accessed 2026-05-26. (Tier 4 — vendor primary source.)
- Bitmovin Status — November 23, 2025 outage post-mortem and September 4, 2025 outage post-mortem. Two recent public streaming-platform post-mortems referenced as exemplars in §7 and §8. https://status.bitmovin.com/history/1. Accessed 2026-05-26. (Tier 4 — vendor primary source.)
- AWS US-EAST-1 Outage — October 19–20, 2025 — Post-Event Summary — AWS. Referenced in §6 as the most recent large-scale cloud-provider incident a streaming team would have planned for. Available via the AWS Post-Event Summaries page. Accessed 2026-05-26. (Tier 4 — vendor primary source.)
- Chaos Engineering: System Resiliency in Practice — Casey Rosenthal, Nora Jones; O'Reilly, 2020 — and Netflix's foundational blog post series on Chaos Monkey, Latency Monkey, and Chaos Kong. The chaos-engineering recommendation in §7. https://netflixtechblog.com/. Accessed 2026-05-26. (Tier 4 — vendor primary source.)
