


Why This Matters
Almost every streaming complaint a product manager hears — "the stream froze", "the quality is awful", "the picture goes blocky for two seconds, then comes back" — is one of these four numbers misbehaving. If you cannot tell them apart, you will read every QoE dashboard wrong and you will sign vendor contracts that promise the wrong guarantee. We wrote this for the smart non-technical reader first — the founder scoping a live shopping app, the operator reading a vendor SLA, the engineer-adjacent person who needs to know which question to ask. By the last section you will have the vocabulary to talk to engineers without bluffing, the arithmetic to size a stream you have never built before, and the thresholds to recognise when a network is healthy enough for the video you want to ship.
The four numbers, defined
Engineering teams treat bandwidth, throughput, jitter, and packet loss as one tangled "network problem". They are four different things with four different causes and four different fixes. Define them once, cleanly, and the rest of the article falls into place.
Bandwidth is the maximum rate at which data can move through a network link, measured in bits per second (bps) or, more usefully for streaming, in megabits per second (Mbps). It is a property of the link itself — the modem, the cable, the radio, the cell tower's allotted spectrum. Cloudflare's definition is the one to memorise: bandwidth is the size of the pipe between two points, the ceiling under which any actual data movement happens. A 100 Mbps fibre line has 100 Mbps of bandwidth whether you are streaming or staring at the desk.
Throughput is the actual rate of data movement you observe over that link, measured in the same bits per second, almost always lower than the bandwidth. Throughput is what a speed test reports. Throughput is what the player's adaptive-bitrate algorithm tries to estimate every few seconds. If bandwidth is the size of the highway, throughput is the speed of the car you are in right now, after traffic, road works, and the speed limit have all taken their share. A 100 Mbps line can deliver 7 Mbps of throughput during an evening peak; the bandwidth has not changed, the throughput has.
Jitter is the variation in the arrival time of consecutive packets, measured in milliseconds. A pipeline of perfectly clocked packets arriving every 20 ms has zero jitter. A pipeline where packets arrive at 20, 23, 18, 26, and 19 ms has jitter on the order of a few milliseconds. The Internet Engineering Task Force defines jitter formally in RFC 3550 (the RTP specification, July 2003) as the statistical variance of packet interarrival time, computed with a smoothing filter shown in section A.8 of that document. We will write out the formula in the section on jitter below.
Packet loss is the fraction of packets that the network drops between sender and receiver and never delivers, expressed as a percentage. A 1% packet loss rate means one packet out of every hundred never arrived. RFC 3550 carries the loss number in every Receiver Report sent over the RTP Control Protocol (RTCP) as a "fraction lost" field — the canonical place a real-time streaming protocol reports its loss.
The four numbers compose: a streaming session is healthy when the bandwidth is large enough, the throughput is consistently close to the bandwidth, the jitter is small, and the loss is near zero. Almost every production failure shows up as a problem with at least one of the four. The rest of the article works each one in turn, then shows how they interact in the protocols you ship.
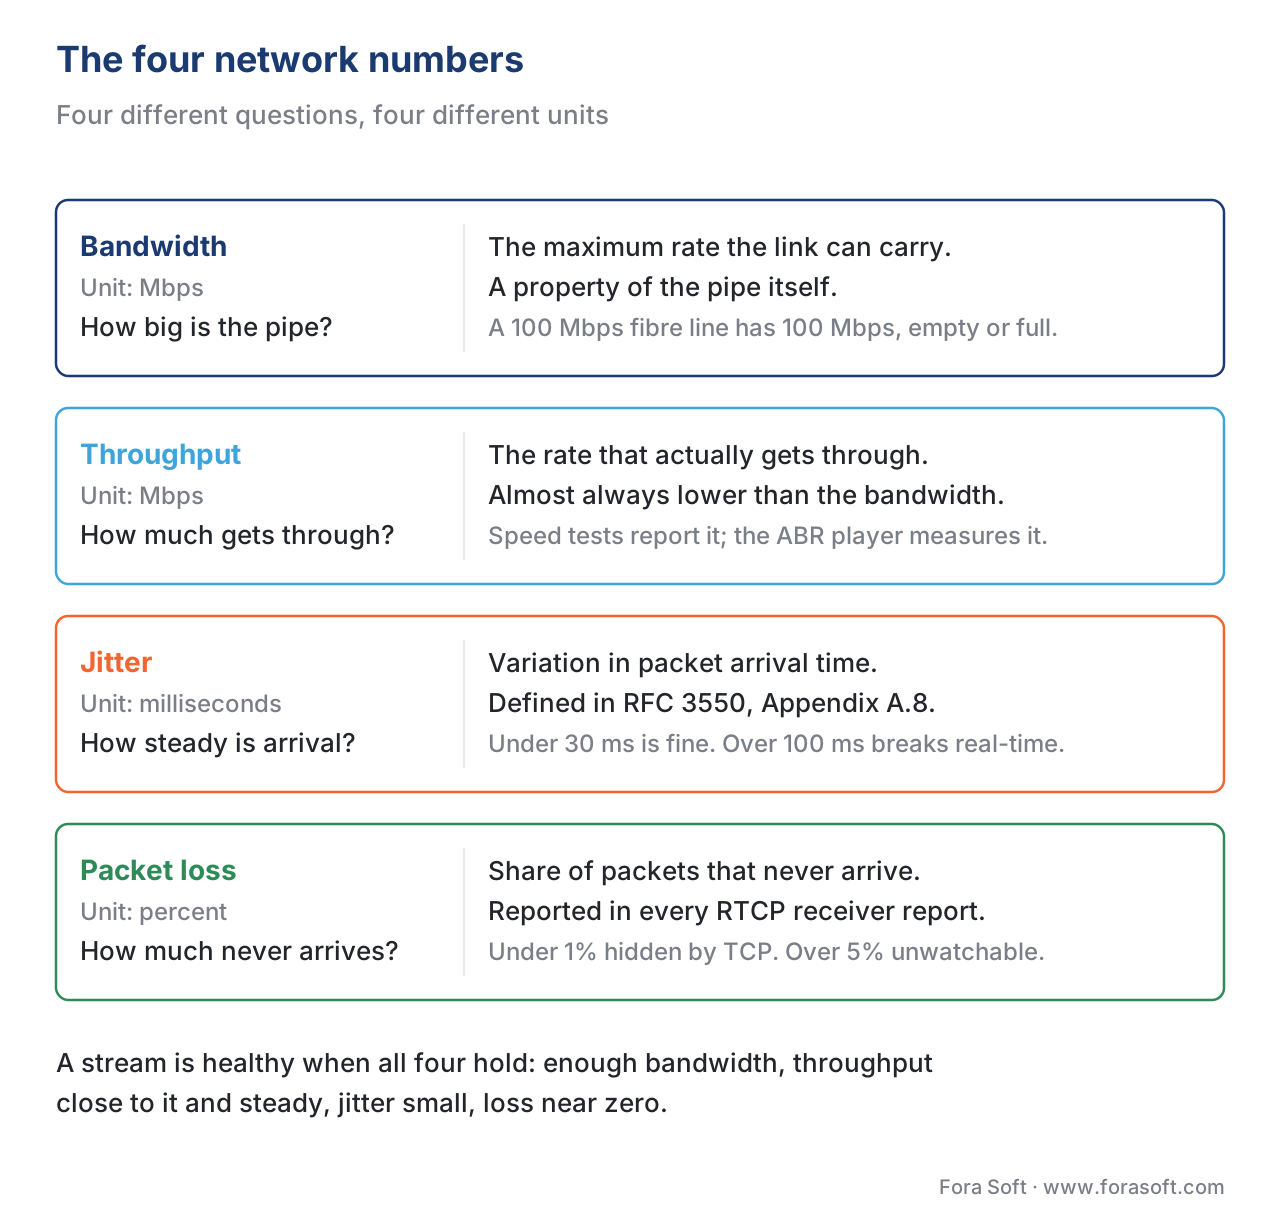 Figure 1. The four network numbers. Each defines a different question; the entire rest of the article builds on getting these clean.
Bandwidth: the size of the pipe
Bandwidth is the easiest number to understand and the one most often misquoted. It is a maximum — the theoretical ceiling under which everything else has to fit. A residential fibre plan advertised as "1 Gbps" sells 1 gigabit per second of bandwidth in one direction. A mobile 5G connection in the field commonly shows 100 to 300 Mbps of bandwidth in a strong-signal area, dropping to 5 to 30 Mbps in weak-signal areas. Ookla's median download bandwidth across U.S. Starlink users was around 220 Mbps in mid-2025, with strong location variance.
For streaming, the bandwidth a viewer has on their connection sets the ceiling of the highest rendition (a fancy word for "quality version") their player can request from the adaptive ladder. If the bandwidth on the viewer's link is 6 Mbps, no amount of clever encoding gets them a 25 Mbps 4K rendition — the bandwidth is not there to carry it. The Apple HLS Authoring Specification (revision 2025-09) makes this explicit: every variant in a master playlist carries a BANDWIDTH attribute that the player uses to filter out anything its current connection cannot support.
A specific number worth memorising. The Apple specification requires every variant's measured peak segment bitrate to be within 25% of its declared BANDWIDTH value (for live streams), and the average segment bitrate over a long window to be within 10% of AVERAGE-BANDWIDTH. The 25% headroom is precisely there because the bandwidth between sender and receiver is never perfectly stable — even on a healthy link, you need slack.
The math out loud, the first time. A standard 1080p video at 30 frames per second, H.264 encoded, ships at roughly 5 Mbps average bitrate, with peaks at 10 Mbps. To play that variant smoothly the viewer needs:
- 5 Mbps × 1.25 (Apple's 25% peak headroom) = 6.25 Mbps of sustained throughput;
- plus the audio track, typically 128 kbps = 0.13 Mbps;
- plus any other browser traffic on the same connection.
Round up to about 7 Mbps of usable throughput for a clean 1080p stream. A connection sold as "10 Mbps" that actually delivers 8 to 9 Mbps under load is fine; a connection sold as "10 Mbps" that drops to 5 Mbps during the evening peak is not. Bandwidth is the marketing number; throughput is what the player sees.
Throughput: what the pipe actually delivers
Throughput is bandwidth's real-world cousin. It is the rate of data movement the player can actually sustain, after every imperfection has taken its cut. Three things drag throughput below bandwidth:
- Distance and round-trip time. Even a fat fibre between London and Sydney delivers less throughput than the same fibre between London and Paris, because the time it takes a packet to be acknowledged caps how much data can be in flight at once. TCP's window-based flow control and QUIC's congestion control (RFC 9000, May 2021) each limit the in-flight bytes to roughly bandwidth × round-trip time — the so-called bandwidth-delay product.
- Loss and retransmission. Every packet that gets dropped has to be sent again. On a 100 Mbps link with 2% loss, the sender is effectively re-doing 2% of its work, and TCP's loss-recovery algorithms (CUBIC, BBR) cut their sending rate even further on the assumption that the loss signals congestion. Throughput in the presence of 2% loss is rarely above 60% of bandwidth on a long-haul TCP connection.
- Competition. The link is shared with other devices, other apps, other tenants. A "100 Mbps" home plan in a family of four streaming three simultaneous shows divides four ways.
Cloudflare's research on home internet quality phrases it well: connection quality — low bufferbloat, low jitter, consistent throughput under load — matters more than raw bandwidth once you are above the minimum threshold. A stable 50 Mbps connection outperforms a flaky 500 Mbps connection for streaming every time.
The single most actionable consequence for a streaming product: the player's adaptive-bitrate algorithm estimates throughput, not bandwidth, when it picks a rendition. A throughput-based algorithm like the one in hls.js samples the recent segment-download time and computes throughput as bytes ÷ seconds. If a viewer's throughput drops from 8 Mbps to 3 Mbps over thirty seconds — because their neighbour started a 4K download — the player switches down to a lower variant within one segment fetch, before the buffer drains. That mechanism is what makes adaptive streaming work in the messy real internet; it is also why your QoE dashboard tracks throughput at the player, not bandwidth at the link.
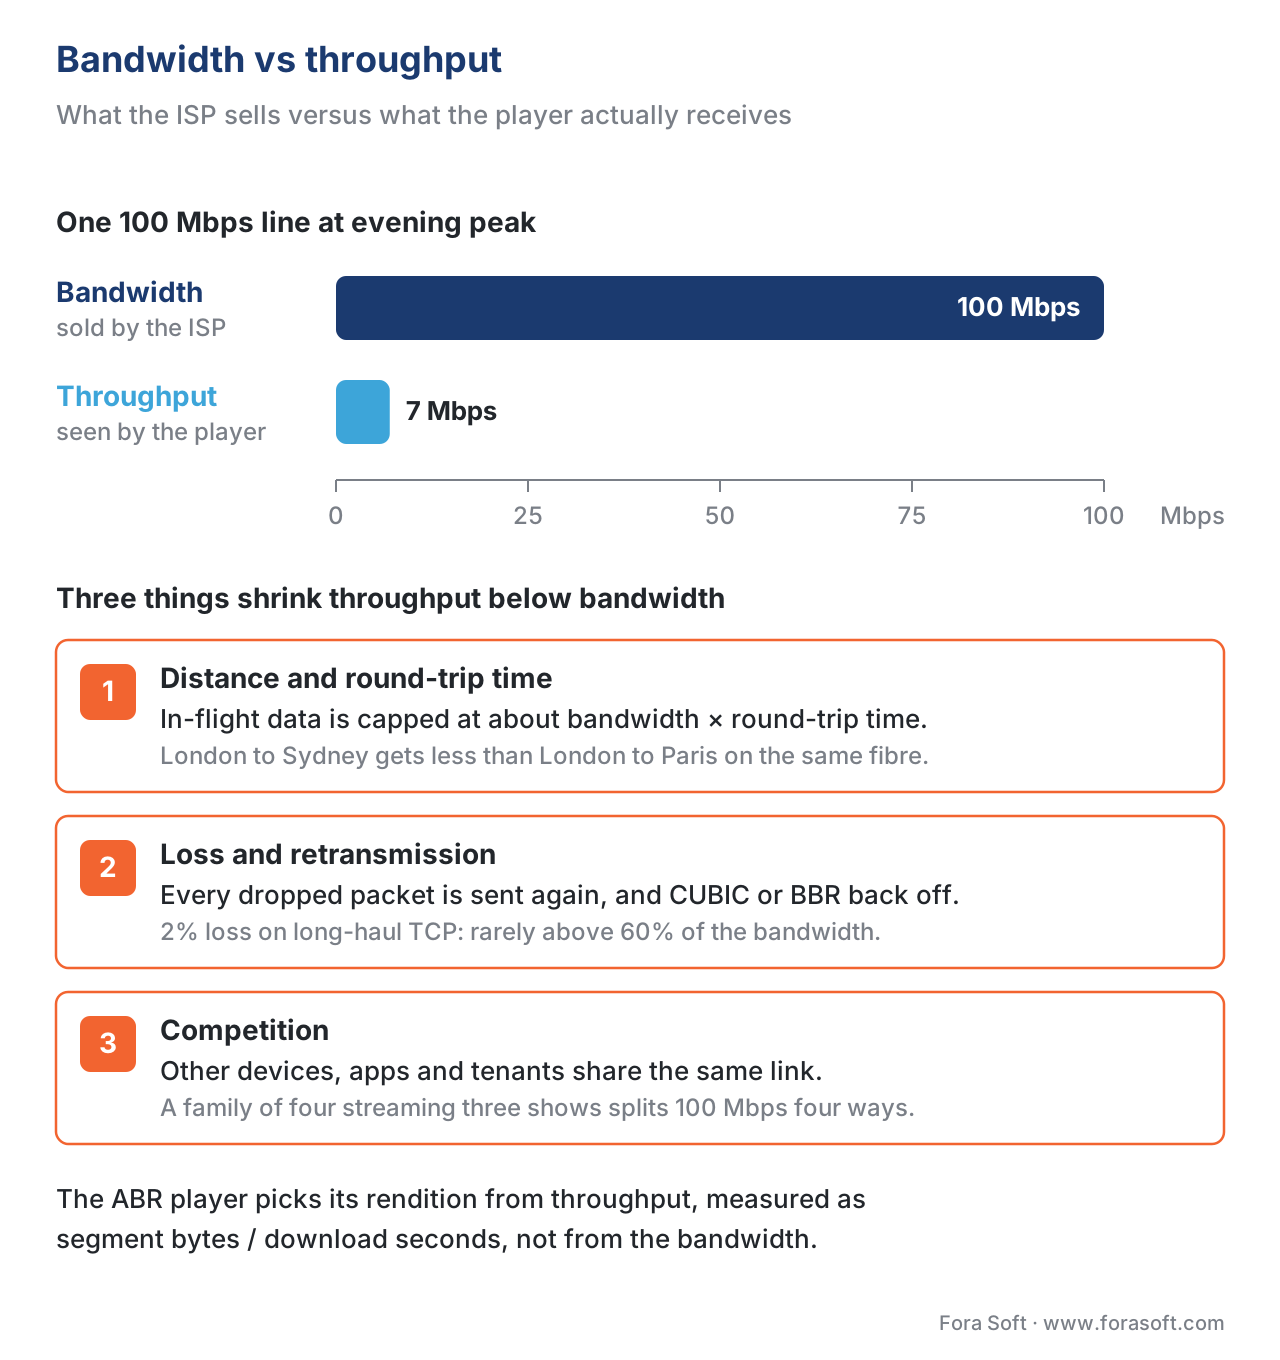 Figure 2. Bandwidth is the maximum the pipe can carry; throughput is what actually comes out. Distance, packet loss, and competition each shrink the gap between the two.
Jitter: the variation that ruins live
Jitter is the term that catches non-technical readers off guard. The word is intuitive — something is "jittery" when it moves unevenly — but the engineering definition is precise. Jitter is the variation in the arrival time of consecutive packets, not the latency itself. A link with a steady 200 ms latency and zero jitter is fine for streaming. A link with a steady 50 ms latency that occasionally spikes to 250 ms has high jitter and is hostile.
RFC 3550 (the RTP standard, July 2003) is the canonical reference. Section 6.4.1 defines an interarrival jitter field carried in every RTCP Receiver Report; Appendix A.8 gives the formula. In words: the receiver computes, for every pair of consecutive packets, the difference between their expected interarrival gap and the actual one, then runs that difference through a smoothing low-pass filter. The exact text from RFC 3550, A.8:
J(i) = J(i-1) + (|D(i-1,i)| - J(i-1)) / 16
J(i) is the jitter estimate after the i-th packet. D(i-1, i) is the difference between the expected and actual interarrival times of the previous and current packet. The divisor 16 is a smoothing factor — the RFC chooses it deliberately to "give a good noise reduction ratio while maintaining a reasonable rate of convergence". The output of that formula is the value any RTP-based monitor reads when it shows you "jitter = 12 ms".
The math out loud. Suppose three packets arrive at times 100, 122, and 138 ms after a reference clock, and the sender had spaced them perfectly at 20 ms apart. The expected interarrival times are both 20 ms. The actual interarrival times are 22 ms and 16 ms. So |D(1,2)| = |20 − 22| = 2 and |D(2,3)| = |20 − 16| = 4. Apply the filter twice, starting from J(0) = 0:
J(1) = 0 + (2 - 0) / 16        = 0.125 ms
J(2) = 0.125 + (4 - 0.125)/16  ≈ 0.37 ms
Tiny, of course — three samples is not enough to converge. The point is the mechanic: the filter weights recent samples lightly so a single outlier does not blow up the estimate, but converges over a few seconds to the steady-state variance.
Why jitter matters for live video specifically: real-time protocols like WebRTC and SRT play packets out on a paced clock. If a packet arrives later than its play-out deadline, the protocol either drops it (WebRTC) or stalls the clock for a few milliseconds (SRT). Either way, you see a glitch. For pre-recorded segmented streaming (HLS, DASH) jitter is far less critical because the player buffers seconds of content ahead and jitter at the millisecond level disappears into that buffer.
Engineering thresholds, distilled from ITU-T Recommendation G.1010 (November 2001), Cisco's published voice-and-video targets, and real-world deployment data:
- Under 30 ms — fine for any video, including conferencing.
- 30–50 ms — fine for buffered streaming, on the edge for real-time conferencing.
- 50–100 ms — segmented streaming still works; WebRTC and SRT start to show visible glitches.
- Over 100 ms — even buffered streaming begins to stutter unless segment durations are long.
Bufferbloat — the condition where a router's queue holds packets too long during congestion — is the single most common cause of jitter spikes on home connections. The Cloudflare Aggregated Internet Measurement (AIM) score, the bufferbloat tests at Waveform and DSLReports, and Conviva's Connection-Induced Rebuffering Ratio (CIRR) all exist precisely because raw bandwidth tests fail to surface this. Starlink, for example, advertises strong bandwidth medians but consistently grades D to F on bufferbloat tests as of 2025 deployments, because its inter-satellite handoff windows briefly bunch and release packets in bursts.
Packet loss: the share that never arrives
Packet loss is the simplest number to measure and the most damaging. When a router on the path is overloaded, the simplest action it can take is to drop the next packet. When a wireless radio loses signal for a tenth of a second, every packet in flight on that radio is gone. The result, measured at the receiver, is a packet-loss rate.
Loss is reported in the same RTCP Receiver Report that carries jitter. The fraction-lost field is an 8-bit fixed-point number: it expresses the packets lost since the previous report as a fraction of those expected. A value of 26 means 26/256, or about 10% loss. Every RTP-based monitor — every WebRTC stats dashboard, every SRT receiver — reads this field.
Why loss matters for streaming: every modern codec (H.264, HEVC, AV1) compresses video by referencing previously sent frames. A single missing packet can corrupt the keyframe (the "I-frame", the self-contained anchor every couple of seconds) and force the decoder to draw garbage until the next keyframe arrives. Even a 1% loss rate, if it falls on the wrong packets, can create visible artefacts every few seconds.
The standard 2026 thresholds, from ITU-T G.1010 and Cisco's voice/video guidelines:
| Loss rate | Effect on segmented streaming (HLS/DASH) | Effect on real-time (WebRTC/SRT) |
|---|---|---|
| 0 – 0.1% | Invisible. | Invisible. |
| 0.1 – 1% | Invisible (TCP retransmits silently). | Mild artefacts; FEC and retransmission cover most. |
| 1 – 3% | Throughput drops, ABR steps down a rung. | Visible blockiness; some frames dropped. |
| 3 – 5% | Buffering events become likely. | Heavy artefacts; viewers complain. |
| Over 5% | Stream unwatchable on most networks. | Codec collapse; protocol may give up. |
Streaming protocols defend themselves against loss in three ways:
- Retransmission (ARQ) — TCP, SRT, and QUIC ask the sender for any packet that did not arrive. ARQ recovers the data but costs latency: every retransmission round adds one round-trip time. SRT (an Internet Draft,
draft-sharabayko-srt-NN) is built around tunable ARQ for contribution links. - Forward error correction (FEC) — the sender ships redundancy data so the receiver can reconstruct lost packets without asking. RIST (SMPTE TR-06) uses FEC for broadcast-grade reliability. WebRTC supports FEC via RFC 5109 and the more modern FlexFEC mechanism.
- Resilient codecs — modern video codecs include slice-level encoding so a single lost slice damages only part of a frame, and scalable codings (SVC, simulcast) so a player can drop a layer without losing the whole stream.
These defences are not free. ARQ adds latency; FEC adds bandwidth (typically 10–30% on top of the source rate); resilient codecs add encoder complexity. The article on picking an ingest protocol in 2026 maps which protocol uses which defence.
 Figure 3. Where packet loss starts to hurt, and what the protocols do about it.
How much bandwidth do you actually need?
This is the question every product manager asks first, and the one engineers hate to answer in a single number. The honest answer is: it depends on the resolution, the frame rate, the codec, the headroom you want for peaks, and the number of streams the household runs in parallel. The 2026 numbers below pull from the Apple HLS Authoring Specification (revision 2025-09), Netflix's published per-rendition bitrates, and YouTube's recommended upload settings.
| Resolution | H.264 average | HEVC average | AV1 average | Required throughput (1.25× peak) |
|---|---|---|---|---|
| 360p 30 fps | 0.6 Mbps | 0.4 Mbps | 0.3 Mbps | 0.8 Mbps |
| 480p 30 fps | 1.1 Mbps | 0.8 Mbps | 0.6 Mbps | 1.4 Mbps |
| 720p 30 fps | 2.4 Mbps | 1.6 Mbps | 1.2 Mbps | 3.0 Mbps |
| 1080p 30 fps | 4.5 Mbps | 3.0 Mbps | 2.4 Mbps | 5.7 Mbps |
| 1080p 60 fps | 6.8 Mbps | 4.5 Mbps | 3.6 Mbps | 8.5 Mbps |
| 4K 30 fps SDR | 15.0 Mbps | 9.0 Mbps | 6.0 Mbps | 18.8 Mbps |
| 4K 60 fps HDR | 25.0 Mbps | 15.0 Mbps | 10.0 Mbps | 31.3 Mbps |
A few notes on reading the table. The averages are realistic 2026 numbers for live or near-live encoding; pre-recorded VOD can use per-title encoding to drop another 10–30% on top. The 1.25× peak column is the minimum throughput the viewer needs to play that rendition without stalling, derived directly from the Apple specification's peak-vs-average rule. The codec columns show the increasing efficiency of HEVC and AV1 over H.264 — Netflix's adoption of AV1 cut their 4K bandwidth from 25 Mbps to around 15 Mbps in 2024 with no visible quality change.
Common mistake to avoid: do not size for the top rendition. Size for the rendition the majority of your viewers will actually receive. If 80% of your audience is on mobile, 720p is the rendition that drives your bandwidth budget — and the player serves 1080p only to viewers whose throughput supports it.
Where the four numbers meet: a worked example
To make all of this concrete, take a small example. You are running a live shopping event. Concurrent peak: 50,000 viewers. Target rendition for the majority: 1080p 30 fps H.264, average 4.5 Mbps. Stream encoded in CMAF with 2-second segments. CDN delivers HLS over TCP.
Bandwidth required at the egress. 50,000 × 4.5 Mbps = 225,000 Mbps = 225 Gbps. That is the peak egress your CDN contract has to deliver.
Throughput each viewer needs. 4.5 Mbps × 1.25 = 5.625 Mbps sustained, plus audio. Call it 6 Mbps. Any viewer whose connection cannot sustain 6 Mbps will step down to a 720p variant; that is fine, your bandwidth at egress drops with them.
Jitter budget. HLS players buffer 6 to 30 seconds of content. Jitter on the order of tens of milliseconds is invisible; jitter spikes of one or two seconds will start to show up as rebuffer events if the buffer is shallow. Keep the player's minimum buffer at ≥ 3 seconds and you absorb almost any home-internet jitter.
Packet loss budget. TCP retransmits anything missing, so as long as the loss rate is under 1% the throughput drops a few percent but the stream stays smooth. Above 3% loss, throughput collapses to a few hundred kbps and viewers cascade down the bitrate ladder, eventually rebuffering. Set the QoE dashboard's alert at 2% loss to a sample of edge-pop monitors and you will see problems before viewers do.
A senior streaming engineer will tighten every one of these numbers for the specific topology, codec, and audience mix. The point of the example is to show how the four numbers compose into a single sizing exercise; the bitrate-to-rendition calculator under our Tools section automates the same arithmetic for any size of audience.
Common mistakes
The single most expensive mistake in this space is treating the four numbers as one. A vendor quoting "we deliver 100 Gbps of bandwidth" is talking about egress capacity — the size of the pipe — and saying nothing about throughput stability under congestion, jitter behaviour during routing transitions, or loss rates on the last mile. A viewer's "10 Mbps connection" might deliver 9 Mbps of throughput on a clean evening and 2 Mbps on a busy Sunday night. The same household might show 5 ms jitter when one device streams and 200 ms when three do.
A second mistake is sizing the bandwidth budget for the top rendition. As shown in the worked example, the rendition that drives the budget is the one most viewers actually receive, weighted by their connection quality. Sizing for 4K when 80% of your audience is on mobile inflates your CDN contract three- to five-fold for no measurable QoE win.
A third mistake — easy to make, painful to fix — is reading the player's reported throughput as the connection's bandwidth. The player measures throughput on the segment it just downloaded. If the player downloaded a low-rendition segment quickly, the throughput reading is artificially capped at that segment's bitrate. The player is not telling you the link bandwidth; it is telling you how fast it just moved a known amount of data. Both numbers matter, but they are different numbers, and the QoE dashboard has to label which one it is showing.
Free download: Streaming Network Reality Cheat SheetOne page: bandwidth, throughput, jitter and packet loss side by side, with the 2026 thresholds at which video starts to break and the throughput each rendition needs.Where Fora Soft Fits In
We have shipped streaming and real-time-media stacks since 2005, across video conferencing, OTT, telemedicine, e-learning, surveillance, and AR/VR. Across those verticals the four numbers in this article are the daily diet — sizing CDN contracts for OTT clients in the 1 Gbps to 1 Tbps range, designing WebRTC-based telemedicine pipelines that hold up on 4G with 2% sporadic loss, and tuning encoder ladders so a live-class e-learning platform delivers 1080p to fibre and 480p to mobile inside the same broadcast. We test every product against jitter and loss budgets in lab before it ships, because the alternative is debugging the same problem live in production at peak. Our video streaming development team builds these network budgets into new products, and our WebRTC and streaming consulting finds where an existing one breaks under loss and jitter.
The book
Video Streaming: A Complete Guide to Video Delivery: From Network Protocols and Transport to Ingest, HLS, and MPEG-DASH
This article gives you the four numbers. Book 2 of the handbook follows them down the stack: what the network does to a stream, TCP versus UDP, congestion control, QUIC and HTTP/3, and how SRT, RIST, HLS and DASH each trade latency for loss recovery. Read it when you are sizing a stream or choosing a protocol and want the arithmetic behind the thresholds. Written by Nikolay Sapunov, CEO at Fora Soft.
Not sure your audience’s networks can carry your stream?
Send us your target resolution, audience size and where your viewers watch from. We will come back with the egress your CDN contract needs, the throughput each viewer needs, and the jitter and loss budgets your protocol choice can survive. 250+ video products shipped since 2005.
See our case studies
Case study
Sprii
Danish live shopping platform with 72,000+ live events and 12.3 million products sold in 2024 — the worked example of this article, where egress is sized for the rendition most shoppers actually receive.
Case study
Worldcast Live
HD concert streaming at 0.4–0.5 s latency for 10,000 simultaneous viewers, with dynamic quality adjustment for poor connections — real-time delivery where jitter and loss decide what the viewer sees.
Case study
Speed.Space
Remote production for Netflix, EA and HBO shoots that records locally at 1080p and 8 Mbps, so the master never depends on the throughput of the talent’s home connection.
What to read next
Transport
TCP, UDP, and the Choice Every Streaming Protocol Must Make
Where throughput, jitter and loss become the variables each protocol trades off.
Networks
Last Mile Reality: Mobile, Satellite (Starlink), 5G, Wi-Fi 6/7
What each last-mile link really delivers, and the jitter and loss it adds under load.
Transport
Congestion Control in Plain English: BBR, CUBIC, Copa, and Why It Matters
Why 2% loss cuts a TCP connection far below its bandwidth, and what BBR changes.
ABR
Throughput-Based ABR Algorithms
How the player turns segment download times into a rendition choice.
References
- Schulzrinne, H., Casner, S., Frederick, R., Jacobson, V. RFC 3550: RTP: A Transport Protocol for Real-Time Applications. IETF, July 2003. The canonical source for the interarrival jitter formula (Appendix A.8) and the fraction-lost field carried in RTCP Receiver Reports (§6.4.1). https://datatracker.ietf.org/doc/html/rfc3550
- Iyengar, J., Thomson, M. (eds.) RFC 9000: QUIC: A UDP-Based Multiplexed and Secure Transport. IETF, May 2021. Defines the bandwidth-delay product and congestion control behaviour that determine throughput on long-haul QUIC connections. https://datatracker.ietf.org/doc/html/rfc9000
- ITU-T Recommendation G.1010. End-user multimedia QoS categories. ITU-T, November 2001. The reference for the multimedia QoS category model and the indicative jitter/loss tolerance bands cited in the thresholds tables. https://www.itu.int/rec/T-REC-G.1010
- Apple Inc. HTTP Live Streaming (HLS) Authoring Specification for Apple Devices, revision 2025-09. Apple Developer Documentation, September 2025. Source of the
BANDWIDTHandAVERAGE-BANDWIDTHrules cited in the bandwidth section, including the 25% peak-vs-declared headroom requirement. https://developer.apple.com/documentation/http-live-streaming/hls-authoring-specification-for-apple-devices - Johansson, I., Sarker, Z. RFC 8298: Self-Clocked Rate Adaptation for Multimedia (SCReAM). IETF, December 2017. Reference for congestion-control behaviour in real-time media (WebRTC) under variable network conditions. https://datatracker.ietf.org/doc/html/rfc8298
- ITU-T Recommendation G.114. One-way transmission time. ITU-T, May 2003. The reference for the 150 ms one-way delay target cited in the jitter section for real-time conferencing comfort. https://www.itu.int/rec/T-REC-G.114
- Conviva. State of Streaming Report, Q4 2025. Conviva, January 2026. Per-region rebuffering and CIRR (Connection-Induced Rebuffering Ratio) data used in the throughput section. https://www.conviva.com/state-of-streaming
- Cloudflare. Aggregated Internet Measurement (AIM) Score. Cloudflare blog, March 2024 (updated 2025). Bufferbloat, jitter, and connection-quality reasoning that informs the "throughput vs bandwidth" framing. https://blog.cloudflare.com/aim-database-for-internet-quality/
- Netflix Tech Blog. AV1 4K rollout: quality at lower bitrates. Netflix, August 2024. Source of the AV1-vs-H.264 bitrate compression numbers in the bandwidth table. https://netflixtechblog.com
- SMPTE TR-06-1, TR-06-2, TR-06-3. Reliable Internet Stream Transport (RIST) Protocol Specification. SMPTE, 2020–2024. The reference for forward error correction in broadcast-grade contribution links cited in the loss section.
- Pantos, R., May, W. RFC 8216: HTTP Live Streaming. IETF, August 2017. The original HLS specification; cited here for the BANDWIDTH attribute in master playlists.
- Ozer, Jan. Encoding ladders for HLS, HEVC, and AV1. Streaming Learning Center, multiple posts 2023–2025. Practical bitrate-ladder targets per resolution and codec, cross-checked against Apple's HLS Authoring Specification.
