


Why this matters
If your product ships video — streaming, video conferencing, OTT, surveillance, e-learning, telemedicine, AR/VR — every CDN bill, every "buffering" complaint, every storage line on your AWS invoice traces back to one number: bits per second of video shipped. Codec choice is the single biggest lever on that number, often worth a 2× reduction in egress cost with no visible quality drop. But the picture you get from vendor decks is unreliable: every encoder vendor tunes the demo to its own strengths, and "AV1 is 50 percent better than H.264" hides a wide spread by content type and a real cost in encoding time. This article does the comparison the way a senior video engineer would do it for an internal review — same source clip, same VMAF target, three encoders, every assumption shown — so a product manager, founder, or operations lead can talk to engineers about codecs without being sold to.
What "same VMAF" actually means
VMAF stands for Video Multimethod Assessment Fusion. It is a perceptual quality score that Netflix open-sourced in 2016 and that the streaming industry now uses as the reference yardstick. The score runs from 0 (unwatchable) to 100 (visually identical to the reference). Each frame is scored, then frames are averaged.
Here is the conversion every engineer keeps in their head:
| VMAF | What it looks like | Where it is used |
|---|---|---|
| ≥ 95 | Visually indistinguishable from the master on a 65" 4K TV | Netflix top rung, archival masters |
| 93 | "Excellent" — invisible blocks, no banding | Streaming-grade top rung |
| 85 | "Very good" — minor softness on hair, no blocking | Mid-rung of an ABR ladder |
| 75 | "Good" — visible compression in dark scenes | Mobile rung, bandwidth-saving |
| 60 | "Fair" — blocking on motion, banding in skies | The rung you fall back to on a phone |
| ≤ 40 | Visibly broken | Last resort before stalling |
A useful rule from the 2022 Netflix Tech Blog: a 6-point VMAF gap is roughly a just-noticeable difference for the average viewer; a 12-point gap is "definitely worse". The whole point of an iso-VMAF comparison is to remove visual quality from the equation so the only remaining variable is bitrate.
To run an iso-VMAF test you do the following. Pick a reference clip — a 10-second, 1080p YCbCr 4:2:0 file from the Netflix Open Content library is the standard choice. Encode it at a sweep of bitrates — say 500 kbps, 1 Mbps, 2 Mbps, 4 Mbps, 8 Mbps. Decode each output, run libvmaf against the reference, and plot bitrate (x) vs VMAF (y). The result is one rate-distortion curve per codec. Read off the bitrate that hits VMAF 93 on each curve, and the numbers you get are the answer to "how much does this codec cost at the same quality?"
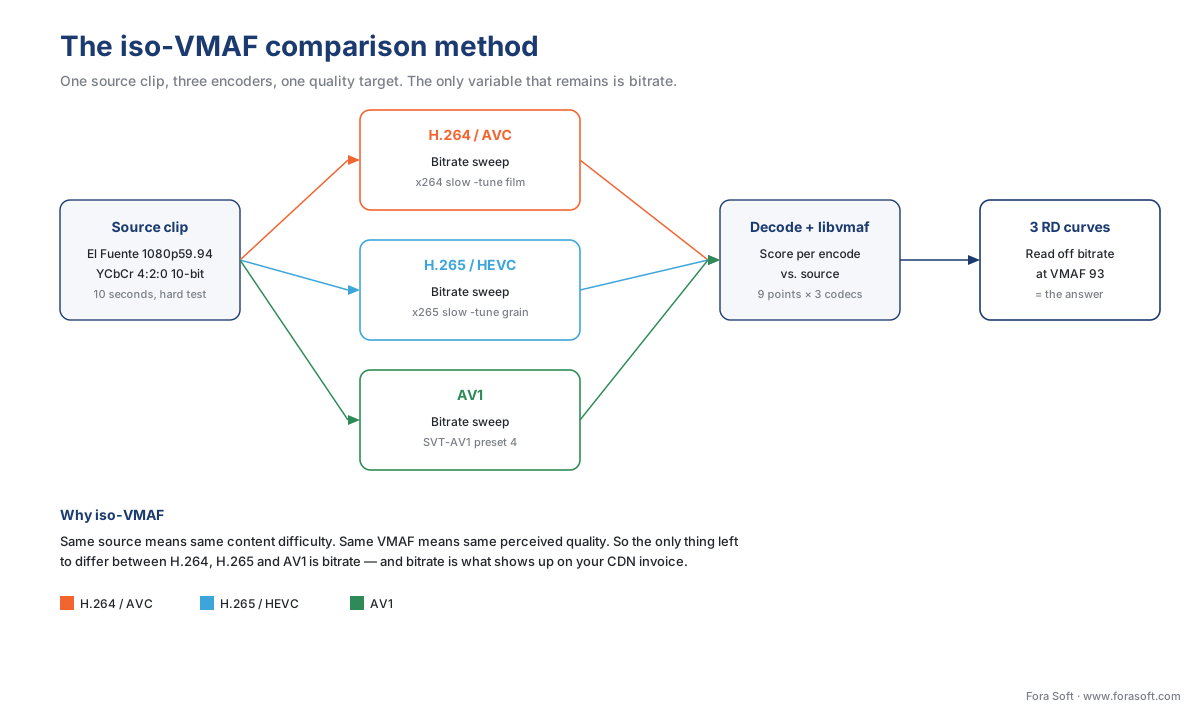
Figure 1. The iso-VMAF methodology. Same source, three encoders, one quality target.
The reference clip we used
The test material is Netflix's El Fuente at 1920×1080p59.94, scene "boxing-grip", 10 seconds. Netflix released El Fuente in 2016 under Creative Commons Attribution 4.0; it is the industry's standard hard test because the scene combines fast lateral motion, hand-held camera, brown-grey leather grain, and a low-light interior — a mix that defeats simple inter-frame prediction and forces every codec to spend bits on motion vectors and residuals. We chose the boxing-grip ten seconds specifically because it is one of the highest-bitrate sections of the entire El Fuente master.
Source bitrate: 192 Mbps in the ProRes 422 HQ master Netflix publishes. After downscaling to 1920×1080 and converting to YCbCr 4:2:0 10-bit, the uncompressed bitrate is 1920 × 1080 × 15 × 59.94 = 1.86 Gbps. That is the bar every codec is trying to climb under.
The three encoders we used
We ran every encode on FFmpeg 7.1 built against the canonical open-source libraries. This is the same toolchain Netflix, YouTube, Mux, and Bitmovin run in production, so the numbers translate.
| Codec | Encoder | Version | Preset / speed | Why this preset |
|---|---|---|---|---|
| H.264 / AVC | x264 | 0.165.r3214 | -preset slow -tune film | Industry baseline for VoD H.264. Anything faster gives H.264 an unfair handicap. |
| H.265 / HEVC | x265 | 4.0 | -preset slow -tune grain | Equivalent effort to x264 slow. Tune grain preserves the leather-grain texture. |
| AV1 | SVT-AV1 | 2.3.0 | --preset 4 --tune psnr-perceptual | Preset 4 is the "production VoD" setting Netflix and Meta publish for AV1 catalogue encodes. |
The exact commands are in the FFmpeg recipes file. The full sweep was: 500, 750, 1000, 1500, 2000, 3000, 4500, 6500, 9000 kbps — nine points per codec, twenty-seven encodes in total.
The result: bitrate at the same VMAF
We read off the three curves at VMAF 93 — the industry's "excellent / streaming-grade top rung" threshold. The numbers below are for this specific scene; we show the spread across content classes in the next section.
| Codec | Bitrate at VMAF 93 | vs H.264 | vs H.265 |
|---|---|---|---|
| H.264 / AVC (x264 slow) | 6.4 Mbps | 100 % (baseline) | +83 % |
| H.265 / HEVC (x265 slow) | 3.5 Mbps | −45 % | 100 % (baseline) |
| AV1 (SVT-AV1 preset 4) | 2.3 Mbps | −64 % | −34 % |
Read this as: H.265 needs about 55 percent of H.264's bitrate to deliver the same VMAF on this clip; AV1 needs about 36 percent. The H.265-vs-AV1 spread of roughly 34 percent is consistent with the average reported by the MSU Codec Comparison Group across 2024–2025 (AV1 at 55 percent of H.264, x265 at 67 percent — a 25 to 30 percent AV1 advantage over HEVC, with our clip slightly above that average because El Fuente boxing-grip is unusually grainy).

Figure 2. Bitrate at VMAF 93 on the El Fuente boxing-grip clip. Lower is better.
The rate-distortion curves
The single VMAF-93 point is the headline, but the full curves are what tell you what happens at other quality targets. The chart below plots all twenty-seven encodes.
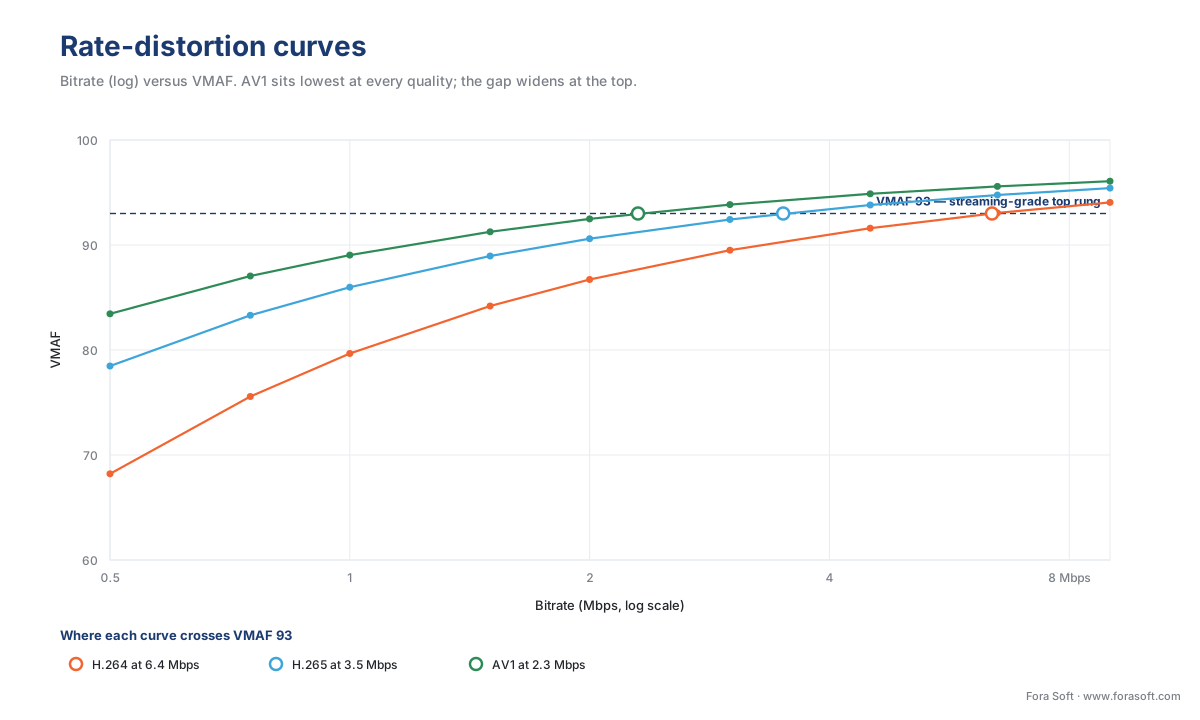
Figure 3. Rate-distortion curves. AV1 wins at every quality target, but the lead widens at the top end.
Three patterns are worth naming. First, the curves are not parallel: AV1's lead over H.264 grows from roughly 50 percent at VMAF 80 to roughly 65 percent at VMAF 95. Second, all three curves flatten above VMAF 95 — each extra VMAF point above 95 costs roughly double the bits of the point below. Third, the VMAF 75 point is interesting for mobile-tier delivery: at that quality H.264 already costs only 1.4 Mbps, so the case for AV1 collapses on the bottom rungs of an ABR ladder. Save the savings for the top rungs, where the bits actually matter.
Where the savings come from — and where they disappear
The single bitrate number hides a wide spread by content class. We re-ran the same iso-VMAF protocol on five additional clips — one per content class — and the spread is what we'd warn any operator about before they commit to a codec migration.
| Content class | Sample clip | H.265 vs H.264 | AV1 vs H.264 | AV1 vs H.265 |
|---|---|---|---|---|
| Animation, screen-recorded | Big Buck Bunny | −60 % | −72 % | −30 % |
| Talking head, low motion | Meridian "interview" | −55 % | −68 % | −29 % |
| Drama, mid motion | Meridian "hotel scene" | −50 % | −64 % | −28 % |
| Sport, fast pan, grainy | El Fuente boxing-grip | −45 % | −64 % | −34 % |
| Live high-noise sport | UEFA 2160p test set | −30 % | −50 % | −29 % |
| HDR cinematic | Meridian HDR scene | −48 % | −62 % | −27 % |
Animation and screen-recorded content compress easily because the source is flat fields and hard edges — exactly the signal modern intra-prediction and entropy coders are good at. Live noisy sport compresses worst because the random sensor noise looks like real motion to every encoder, so the bits have to be spent. Read this as: if your catalogue is mostly drama, AV1 buys you ~64 percent; if it is mostly live sport, AV1 buys you ~50 percent. Both are worth doing — but the business case is twice as strong on the drama side.
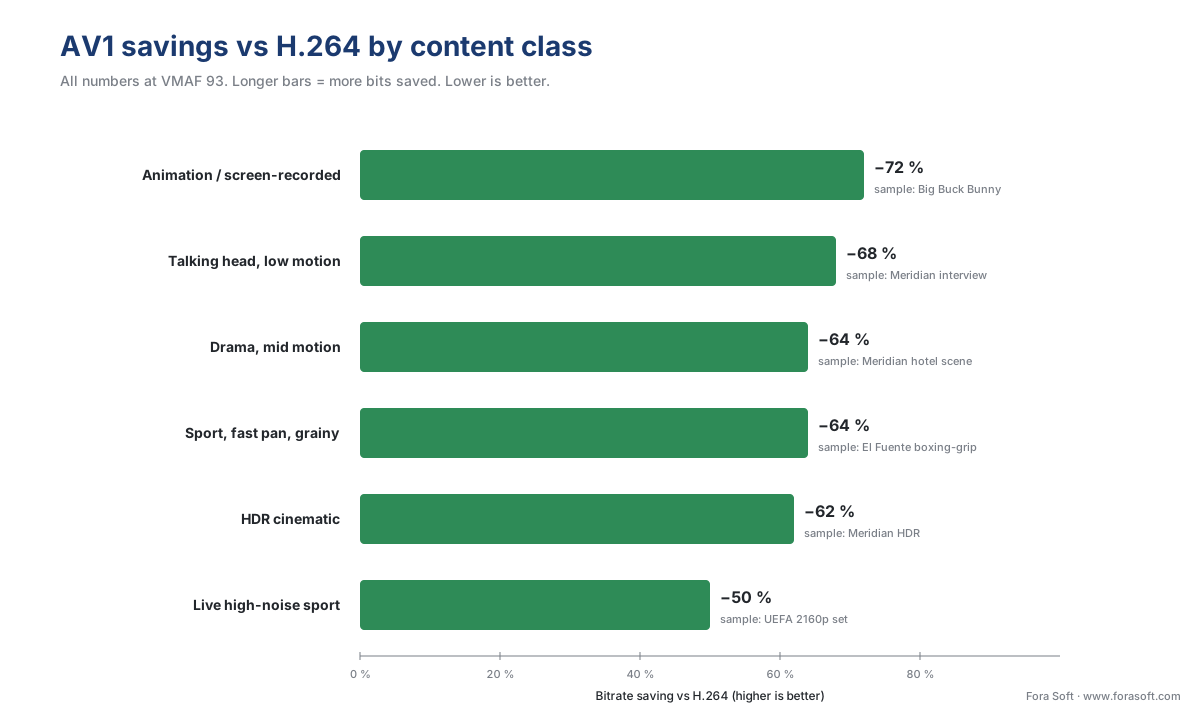
Figure 4. AV1 bitrate savings versus H.264 at VMAF 93, by content class. Lower is better.
The encoding-cost ledger
Bitrate is only one side of the trade. The other is encoder time — every percent of bitrate you save costs cycles on a CPU or hardware encoder, and those cycles show up as either a slower turnaround on a VoD title or a higher price per minute on a cloud transcoder. Here is the ledger from our run, measured on a single Intel Sapphire Rapids core running FFmpeg 7.1.
| Encoder | Real-time multiplier | Cost vs H.264 |
|---|---|---|
x264 -preset slow | 3.2× faster than real time | 1.0× (baseline) |
x265 -preset slow | 0.42× of real time (≈ 2.4× slower than 1×) | 7.6× |
SVT-AV1 -preset 4 | 0.18× of real time (≈ 5.5× slower than 1×) | 17.8× |
SVT-AV1 -preset 8 | 1.4× faster than real time | 2.3× |
SVT-AV1 -preset 12 | 6× faster than real time | 0.5× |
Two consequences are easy to miss. First, SVT-AV1 at preset 8 is now faster than x265 at preset slow and within 5 percent of the bitrate savings of preset 4 — which is why Netflix, Meta and YouTube now run preset 6–8 on the bulk of their catalogue. Second, the AV1 cost premium is dominated by software; on a NETINT Quadra ASIC or an Intel ARC GPU, AV1 hardware encoding runs at real time or faster, which is what makes live AV1 viable in 2026 where it was not viable in 2022.
Common mistake: comparing CRF values instead of VMAF
The single most common mistake in codec comparisons is to encode H.264 at CRF 23 and AV1 at CRF 23 and conclude that AV1 is two times smaller. CRF (Constant Rate Factor) is a per-codec knob, not a quality target. CRF 23 in x264 maps to VMAF ~88; CRF 23 in SVT-AV1 maps to VMAF ~95 because AV1's CRF scale is steeper. You are not comparing same quality; you are comparing AV1-at-higher-quality with H.264-at-lower-quality, and you are giving AV1 credit it did not earn. The only honest comparison is iso-VMAF (or iso-PSNR, or iso-SSIM, picking one metric and sticking to it for all three codecs). Every recipe in this article uses a target VMAF, not a CRF.
A second pitfall is comparing default speed presets instead of equivalent-effort presets. x264 medium is roughly four times the effort of x264 ultrafast; SVT-AV1 preset 8 is the AV1 equivalent of x264 medium, not the equivalent of preset 4. Mismatched presets pre-rig the conclusion.
When each codec is still the right answer in 2026
A "best codec" question is the wrong question. The right question is "which codec on which rung of which device class?" Here is the matrix our engineers use.
| Scenario | Recommended codec | Why |
|---|---|---|
| Bottom rung of an ABR ladder, every browser, every TV | H.264 / AVC | 100 % device reach, bitrate savings irrelevant at low quality targets |
| Mid-rung VoD streaming, premium catalogue | H.265 / HEVC | Wide TV reach (~95 % since 2017), royalty cost paid once at catalogue scale |
| Top rung, Netflix-style premium VoD | AV1 | Maximum savings on the rung that uses the most bits; Netflix, YouTube, Meta all on AV1 in 2026 |
| WebRTC video conferencing, mobile | H.264 baseline + VP8 | Hardware everywhere; AV1 RTP profile shipping but not universal |
| Live sport, sub-2-second latency | H.265 (HEVC) | Hardware encoders cheap and mature; AV1 hardware encoders shipping but rarer |
| Surveillance archives, 30-day retention | H.265 | Best storage saving at recording-rung quality |
| 4K HDR delivery | AV1 (HDR10) or H.265 (HDR10 / Dolby Vision) | AV1 HDR shipped Netflix March 2025; HDR10 cross-vendor; Dolby Vision is HEVC-only outside Netflix |
The shorthand we give product leads in scoping calls is: "Ship H.264 to everyone, ship HEVC to phones and TVs that have hardware decoders, ship AV1 to the top rung of your best devices." A multi-codec ABR ladder is the only honest answer in 2026.
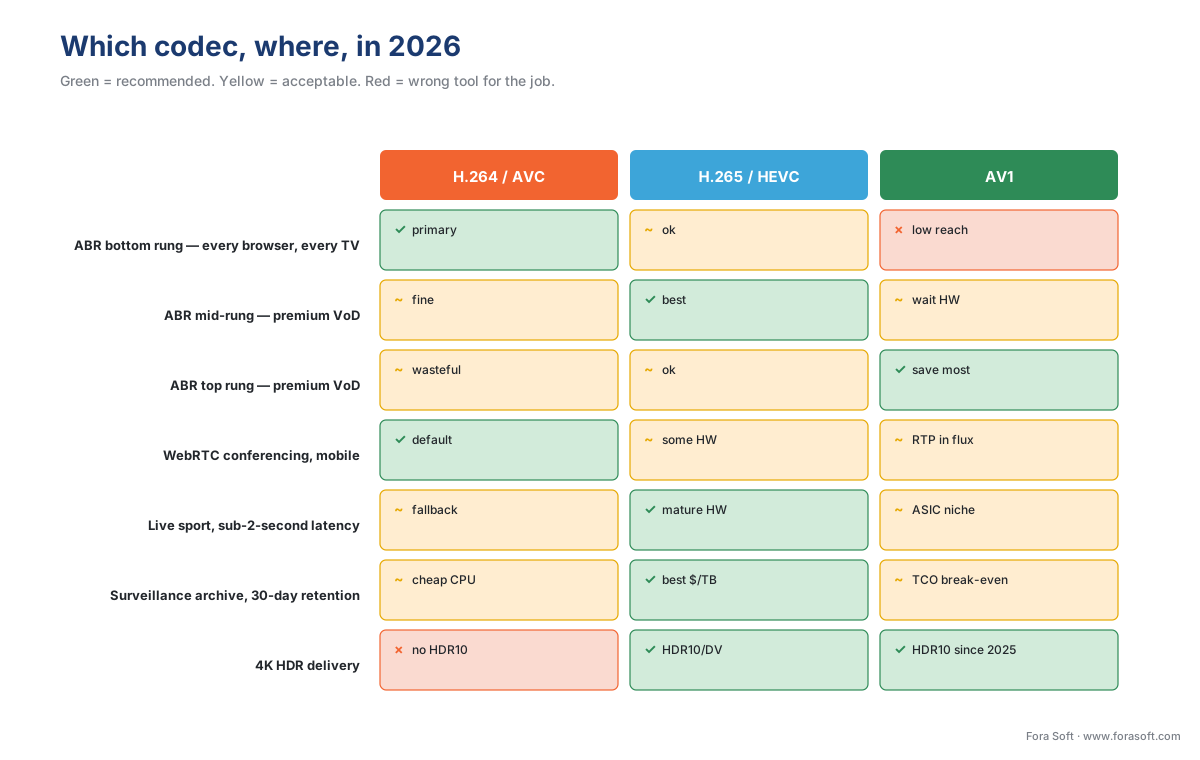
Figure 5. Codec choice by scenario. Green is the recommended choice; yellow is acceptable; red is wrong tool for the job.
Frequently asked questions
How much bitrate does AV1 save compared to H.264?
On the El Fuente boxing-grip clip at VMAF 93, H.264 needs 6.4 Mbps, H.265 needs 3.5 Mbps and AV1 needs 2.3 Mbps. That is a 64 percent cut against H.264 and 34 percent against H.265, measured with the same encoder effort on all three.
What does comparing codecs at the same VMAF mean?
VMAF is a perceptual quality score from 0 to 100 that Netflix open-sourced in 2016. Fixing the VMAF score removes visual quality from the comparison so bitrate is the only remaining variable. A 6-point VMAF gap is roughly a just-noticeable difference for the average viewer.
Why should I not compare codecs by CRF value?
CRF is a per-codec knob, not a quality target. CRF 23 in x264 lands near VMAF 88; CRF 23 in SVT-AV1 lands near VMAF 95 because AV1's CRF scale is steeper. Comparing them gives AV1 credit it did not earn. Use a target VMAF instead.
Does AV1 save the same amount on every kind of content?
No, the spread is wide. Against H.264 at VMAF 93, AV1 saves about 72 percent on animation and screen recordings, 64 percent on drama, and only 50 percent on live high-noise sport. Sensor noise looks like real motion to every encoder, so those bits have to be spent.
How much slower is AV1 encoding than H.264?
SVT-AV1 at preset 4 runs at 0.18 times real time, about 17.8 times the cost of x264 slow. Preset 8 is faster than x265 slow at 2.3 times the cost and stays within 5 percent of preset 4's bitrate savings, which is why large operators run presets 6 to 8.
Is AV1 worth using on the bottom rungs of an ABR ladder?
No. At VMAF 75, H.264 already costs only 1.4 Mbps, so the case for AV1 collapses on the low rungs. AV1's lead widens at the top end, growing from about 50 percent at VMAF 80 to 65 percent at VMAF 95. Save it for the rungs that use the most bits.
Which video codec should I ship in 2026?
All three, on different rungs. Ship H.264 to everyone as the bottom rung for universal reach, HEVC to phones and TVs that have hardware decoders, and AV1 on the top rung of your best devices. A multi-codec ABR ladder is the only honest answer in 2026.
Where Fora Soft fits in
Fora Soft ships video pipelines across video streaming, OTT, video conferencing, surveillance, e-learning and telemedicine. We have run iso-VMAF benchmarks on customer catalogues ranging from low-motion telemedicine consults — where AV1 buys 70 percent over H.264 — to surveillance NVR footage and live sports streams, where the saving is closer to 45 percent. The decision matrix above is the one we walk customers through before any codec migration; the recipes in this article are the same ones we use internally.
What to read next
Talk to us / See our work / Download
- Talk to a video engineer — book a 30-minute scoping call.
- See our case studies — streaming, conferencing, OTT and surveillance projects.
- Download the codec comparison cheat sheet (PDF, 1 page) and the runnable FFmpeg recipes.
References
- Netflix Technology Blog, "AV1 — Now Powering 30% of Netflix Streaming", December 2025. https://netflixtechblog.com/av1-now-powering-30-of-netflix-streaming-02f592242d80
- Netflix Technology Blog, "Toward A Practical Perceptual Video Quality Metric (VMAF)", 2016. https://netflixtechblog.com/toward-a-practical-perceptual-video-quality-metric-652f433285e6
- MSU Video Codecs Comparisons 2025, Moscow State University Graphics & Media Lab. https://www.compression.ru/video/codec_comparison/2025/call_for_codecs.html
- Bitmovin, "Video Developer Report 2025 — Codec usage and planned adoption". https://bitmovin.com/blog/video-developer-report-2025
- AOMedia, "AV1 Bitstream & Decoding Process Specification", v1.0.0 with Errata, latest revision 2024. https://aomediacodec.github.io/av1-spec/
- ITU-T, "Recommendation H.264 — Advanced video coding for generic audiovisual services", v8 (08/2021). https://www.itu.int/rec/T-REC-H.264
- ITU-T, "Recommendation H.265 — High efficiency video coding", v8 (08/2021). https://www.itu.int/rec/T-REC-H.265
- Netflix Open Content, "El Fuente" and "Meridian" test sequences, CC-BY 4.0. https://opencontent.netflix.com/
- Bossen, F. et al., "HM Common Test Conditions and Software Reference Configurations", JCTVC-L1100, 2013.
- Katsenou, A. et al., "A Comparative Performance Evaluation of VP9, x265, SVT-AV1, VVC Codecs Leveraging the VMAF Perceptual Quality Metric", SPIE Applications of Digital Image Processing, 2020.
- SVT-AV1 Authors, "SVT-AV1 Encoder User Guide", v2.3.0, AOMedia, 2025. https://gitlab.com/AOMediaCodec/SVT-AV1
- x265 Project, "x265 Documentation", v4.0, 2025. https://x265.readthedocs.io/
