


Why this matters
CDN is the loudest cost line, but it is rarely the one that kills the gross margin. Bitmovin's 2025 Video Developer Report names cost control as the number-one challenge for 38% of video teams — more than any technical concern — and the reason is that the bill is not one number, it is eight. A subscription video product at 100,000 monthly active users can spend more on analytics than on storage, more on DRM key requests than on origin egress, and more on TURN bandwidth than on the entire CDN — depending on the product shape. The reader for this article is the engineer or founder who has been asked "what does it cost to serve one hour of video?" and the finance lead who must defend the build-versus-buy decisions to the board. By the end, both should be able to read a vendor invoice line by line, derive the cost-per-viewer-hour for each of the eight lines, project the all-in spend at 10× scale, and identify which two lines deserve the next round of optimisation work.
The eight lines of a streaming cost stack
Before we put numbers on anything, we need a complete list of what gets billed. The headline rate — "we pay our CDN $X per gigabyte" — is only the first of eight independent meters, and the cheap-looking ones routinely become the most expensive at scale.
The first line is encoding — the cost of turning the source mezzanine file (or the live contribution feed) into the ladder of bitrates the player will actually pick from. VOD encoding is metered per minute of output, multiplied by the number of renditions on the ladder. Live encoding is metered per channel-hour, multiplied by the number of inputs and outputs. AWS Elemental MediaConvert's professional tier prices an HD AVC output at $0.0150 per minute and a UHD output at $0.0300 per minute as of May 2026; MediaLive prices an HD live channel input at $0.7656 per hour and a UHD input at $1.7225 per hour, with up to 75% off for a 12-month reserved commit. The same workload on bitmovin, Mux, or a self-hosted FFmpeg / SVT-AV1 farm produces different absolute numbers but the same shape: per-minute or per-hour, multiplied by a "ladder rungs × codecs" factor.
The second line is packaging — wrapping the encoder's output into HLS, DASH, CMAF, and whichever progressive-download flavours your client matrix demands. On most modern stacks packaging is bundled into the encoder fee (CMAF unifies HLS and DASH, and a single CMAF packaging pass produces both manifests), so the marginal cost is small. It shows up as a real line when you ship multi-DRM with packaging-time key insertion, or when just-in-time packaging at the origin trades encoder cost for origin CPU cost. We will track it as a separate line because it has a separate scaling shape from the encoder line and is the easiest line to optimise away.
The third line is storage and origin egress — the cost of holding every segment of every rendition of every asset somewhere durable, plus the cost of feeding the CDN with cache-miss bytes. Storage is cheap on a per-GB basis (S3 Standard at $0.023/GB-month in May 2026; deeper tiers down to $0.0036/GB-month for Glacier Instant Retrieval) but scales linearly with library size and with the number of ladder rungs. Origin egress is the line most teams miss: when the origin and CDN sit in the same cloud — S3 plus CloudFront, GCS plus Cloud CDN — the cloud waives it. When they don't — S3 origin behind a Cloudflare or Fastly distribution — every cache miss pulls bytes out of AWS at the standard egress rate of $0.05–$0.09 per GB. We cover the underlying CDN-side meters in the dedicated CDN cost economics article; this article puts the origin side on the same balance sheet.
The fourth line is CDN delivery — the bytes the CDN ships from the edge to viewers. This is the line everyone plans for, and the only one with a per-GB headline. CloudFront's pay-as-you-go US/EU rate starts at $0.085/GB after the first free terabyte, slides down to $0.020/GB at petabyte scale, and is roughly halved on a committed-use deal with Akamai, Fastly, or a CDN-native streaming provider. Cloudflare and BunnyCDN run at the cheap end with flat or near-flat pricing. The full mechanics — 95th percentile, commit-and-overage, four meters per provider — are in the CDN cost economics article.
The fifth line is DRM — the per-license fee for every encrypted-playback decision your players make. Even though the underlying schemes (Widevine, FairPlay, PlayReady) are free at the technology layer, the operational reality is that you pay a multi-DRM vendor (EZDRM, BuyDRM, DRMtoday, Castlabs, Axinom, Verimatrix, doverunner, Mux's DRM add-on) to host the license servers and to do the certificate dance with Apple. Pricing models split into two camps. Per-stream and per-license models charge a fraction of a cent per encrypted view — Mux's DRM add-on at $100/month + $0.003 per view in May 2026, doverunner at $299 + $0.06/user for the first 9,000 over the base and $0.04/user above that. Subscription models charge a monthly fee that bundles a usage allowance — EZDRM starting at $199.99/month, BuyDRM at $99/month, DRMtoday in tiered packages. We cover the three DRMs themselves in the DRM 101 multi-DRM article; this article puts the cost on the model.
The sixth line is analytics — the QoE and QoS telemetry the player ships back to a SaaS dashboard. Mux Data, Conviva, Bitmovin Analytics, Datazoom, NPAW (YOUBORA) all bill per viewer-hour or per session, with sticker prices that range from roughly $0.0005 to $0.005 per viewer-hour depending on volume, contract length, and how much "AI-assisted incident response" you bolt on. Analytics is the line that quietly grows past CDN on subscription VOD workloads with high engagement: a viewer-hour that costs $0.001 of CDN at scale can cost $0.002 of analytics if you're on a per-hour plan. The vendor landscape is in the analytics platforms comparison article; the unit economics are in this article.
The seventh line is real-time relays — the TURN servers that punch through NAT for WebRTC traffic, plus the SFUs that fan out a publisher's stream to multiple subscribers. If your product is pure HLS/DASH VOD, this line is zero. If you ship video conferencing, telemedicine, real-time auctions, or any live interactive use case, TURN can become the largest single line on the bill, because TURN relays carry the full media payload — both directions — and a single one-to-many call at 1 Mbps with ten participants is shipping 10 Mbps through the relay. SFU-hosted bandwidth follows the same logic but at a higher per-bit cost because the SFU is doing extra CPU work. We treat TURN and SFU as one line for cost-model purposes, with the SFU comparison and topology articles (SFU vs MCU vs Mesh, mediasoup / Janus / LiveKit / Jitsi / Pion comparison) covering the architecture detail.
The eighth line is engineering and operations — the salaries of the people who keep the seven previous lines healthy, plus the on-call rotation, plus the monitoring stack, plus the inevitable AWS support contract. This line is the largest of all on most teams below ~100k MAU, the second-largest at most teams above 1M MAU, and the line most often left out of "cost per viewer-hour" decks. We include it because the build-versus-buy crossover for every other line is decided by it.
 Figure 1. The eight lines on a streaming cost stack — each one is metered differently and scales on a different driver. A model that adds only the first four is incomplete.
The worked model: 100,000 MAU, hybrid live + VOD
Let me put numbers on every line with a concrete example. The product is a hybrid streaming app — half VOD library, half scheduled live events, with a small WebRTC interactive layer — at one hundred thousand monthly active users. The inputs:
- MAU: 100,000.
- Average monthly viewing hours per MAU: 12 (Bitmovin's 2025 industry median for hybrid OTT — heavy users skew this).
- Average rendition bitrate (blended across ladder): 4.0 Mbps. The ladder ships 240p / 360p / 480p / 720p / 1080p; ABR usage in the wild settles at roughly 4.0 Mbps when weighted by viewer device mix and Wi-Fi-versus-cellular split.
- Live share of viewing hours: 30%.
- DRM-protected share of viewing hours: 70% (the VOD library is studio-licensed; live events are unprotected promotional content).
- WebRTC-interactive viewing hours: 5% of total, with an average call group of four participants.
- Library size: 6,000 hours of VOD.
- Live channels: 4 HD channels, running 8 hours/day average.
That gives us the total monthly viewing-hours figure first, because it drives almost every line:
total_view_hours = MAU × hours_per_MAU
                 = 100,000 × 12
                 = 1,200,000 hours/month
A 4.0 Mbps stream consumes 1.8 GB per hour:
GB_per_hour = bitrate_Mbps × 3600s / 8000 (Mb/GB conversion)
            = 4.0 × 3600 / 8000
            = 1.8 GB
So the total egress demand for the month is:
egress_TB = 1,200,000 × 1.8 / 1024
          = 2,109 TB/month
We will reuse those three numbers (1.2M view-hours, 1.8 GB/hour, 2,109 TB/month) for every line below. Now we walk the stack.
Line 1 — Encoding
VOD encoding is a one-time-per-asset cost. New content added per month — call it 100 hours — produces 6,000 minutes of source, which the ladder fans out into roughly five renditions, three of which are HD-class. At MediaConvert professional tier (May 2026 rates: $0.0150/min HD, $0.0075/min SD, with tiered discounts kicking in past 100,000 normalized minutes per month), 6,000 source minutes × 5 renditions × ~$0.0115 blended is about $345/month. Re-encoding existing library to a new codec (AV1 in 2026) is a sunk batch operation, amortised: 6,000 hours × 60 min/hour × 5 renditions × $0.0115 / 24 months payback period ≈ $863/month amortised.
Live encoding is metered per channel-hour:
live_channel_hours = 4 channels × 8 hours/day × 30 days
                   = 960 channel-hours/month
At MediaLive HD on-demand pricing of $0.7656/hour per input plus roughly $0.50/hour per HD output (5-rung ladder = effectively 2.5 HD outputs after the SD/HD bundling discount), per-channel hourly cost lands around $1.90. On a 75%-discounted 12-month reserved commit it drops to roughly $0.48. We will assume the reserved commit since this is steady-state operation:
live_encoding_cost = 960 × $0.48
                   ≈ $461/month
Encoding total, all in: ~$1,670/month. Per viewer-hour: $1,670 / 1.2M = $0.0014 / hr.
Line 2 — Packaging
CMAF packaging is bundled in the encoder fee on every modern stack. We assign $0/month as a separate line. (The article keeps the line on the model so that teams who later move to just-in-time packaging can split it out — JIT shifts encoder cost into origin CPU cost without changing the total, but the per-line view changes.)
Line 3 — Storage and origin egress
Library size in bytes:
library_size_TB = 6,000 hours × 1.8 GB/hr × 5 renditions / 1024
                 = 52.7 TB
At S3 Standard ($0.023/GB-month in May 2026): 52,700 × $0.023 = $1,212/month. With a lifecycle policy moving cold content to Standard-IA ($0.0125/GB-month) after 30 days of last access, the blended rate drops to about $0.016/GB-month: 52,700 × $0.016 = $843/month. We will use the lifecycle figure.
Origin egress at a 92% CDN cache hit ratio (a realistic number for a hybrid library with a fat-head viewing distribution, and the same figure used in our CDN cost economics article):
origin_egress_TB = total_egress_TB × (1 - cache_hit_ratio)
                 = 2,109 × 0.08
                 = 169 TB/month
If the CDN is CloudFront with S3 origin, AWS waives this — $0. If the CDN is Cloudflare with S3 origin, AWS bills it at the in-region egress rate (the AWS PrivateLink / S3-to-Cloudflare path qualifies for the cheaper $0.04/GB regional egress, not the $0.09/GB internet egress, in May 2026 — and Cloudflare's R2 origin would have waived it entirely). We will model a CloudFront primary plus a Fastly secondary for the multi-CDN case, so the Fastly path pulls origin egress: 0.5 × 169 TB × $0.04/GB × 1024 = $3,471/month for the secondary's share.
Storage + origin total: $843 + $3,471 = $4,314/month. Per viewer-hour: $0.0036 / hr.
Line 4 — CDN delivery
Total egress 2,109 TB/month. On a single-CDN committed contract at $0.012/GB blended (a representative 2026 mid-volume CDN commit rate), the bill is:
cdn_cost = 2,109 × 1024 × $0.012
         = $25,915/month
On a multi-CDN split of 70% CloudFront committed and 30% Fastly committed at slightly higher per-GB rate of $0.014:
cdn_cost = 0.70 × 2,109 × 1024 × $0.012 + 0.30 × 2,109 × 1024 × $0.014
         = $18,140 + $9,068
         = $27,208/month
Multi-CDN is the more expensive nominal arrangement; the saving comes elsewhere (overage avoidance on a heavy month, regional rate optimisation, reliability premium that translates to lower abandonment — the multi-CDN architecture article has the full case). For the model we will use the multi-CDN figure of $27,208/month, knowing that the single-CDN equivalent is $25,915 and that swing matters at this scale. Per viewer-hour: $0.0227 / hr on multi-CDN, $0.0216 / hr on single.
Line 5 — DRM
70% of viewing hours are DRM-protected, but DRM bills on license requests, not on hours. A license request typically happens once per asset per playback session — not once per segment. Industry averages put the ratio at roughly 1 license request per 30 minutes of viewing (long-form OTT) up to 1 per 5 minutes (short-form mobile). We will assume 1 per 30 minutes for the hybrid product:
licenses_per_month = total_view_hours × DRM_share × 60min/hour / 30min/license
                   = 1,200,000 × 0.70 × 60 / 30
                   = 1,680,000 licenses
At a representative 2026 multi-DRM SaaS rate of $0.003 per license (Mux's add-on rate; EZDRM and BuyDRM volume tiers land at $0.001–$0.0025 per license for this volume):
drm_cost = 1,680,000 × $0.003
         = $5,040/month
A negotiated annual commit at $0.0015 per license drops it to $2,520/month. We will use $0.002 as a blended assumption: $3,360/month. Per viewer-hour (of all hours, not just protected ones): $0.0028 / hr.
Line 6 — Analytics
QoE analytics is metered per viewer-hour by every major vendor; only the per-hour rate differs. Mux Data lists a pay-as-you-go rate near $0.0008 per viewer-minute ($0.048 per hour) for entry tiers, dropping toward $0.0005 per minute ($0.030 per hour) at mid scale; Conviva and Bitmovin Analytics land in a similar range with negotiated rates as low as $0.0002 per minute ($0.012 per hour) at large enterprise volume. For 1.2M view-hours per month, a mid-scale Mux Data rate of $0.030 per hour gives:
analytics_cost = 1,200,000 × $0.030
              = $36,000/month
That number is shocking the first time you see it — larger than the CDN bill. It is also why heavy-engagement subscription products usually do not stay on per-hour analytics past their first year and either negotiate a flat-rate annual commit (typical reduction: 60–80%) or move to a self-hosted Prometheus + ClickHouse + Grafana stack that costs the same fixed $3–5k/month at any volume. We will model a negotiated commit at $0.008 per viewer-hour blended:
analytics_cost = 1,200,000 × $0.008
              = $9,600/month
Per viewer-hour: $0.008 / hr.
Line 7 — Real-time relays (TURN + SFU)
5% of viewing hours go through the WebRTC interactive layer with an average call group of four participants:
webrtc_user_hours = 0.05 × 1,200,000 = 60,000 user-hours
A user-hour of WebRTC at the same 4 Mbps blended bitrate produces 1.8 GB of media. Industry-typical TURN-relay-hit rates (the share of WebRTC sessions that fail peer-to-peer and fall back through TURN) sit around 15–20% in 2026 because of corporate firewalls and symmetric NATs. Assume 20%:
turn_GB = 60,000 user-hours × 1.8 GB × 0.20
        = 21,600 GB = 21.6 TB
At a representative coturn-on-EC2 cost of $0.085/GB outbound (EC2 internet egress is unforgiving at this rate) or roughly $0.06/GB on a private peered TURN deployment:
turn_cost = 21,600 × $0.06
          = $1,296/month
The SFU bandwidth (the 80% non-TURN traffic that still hits the SFU for routing) at the same $0.085/GB egress, scaled by the SFU fan-out factor — for a 4-person call, average fan-out is 3 (each publisher to 3 subscribers):
sfu_GB = 0.80 × 60,000 × 1.8 GB × 3
       = 259,200 GB = 259 TB
sfu_cost = 259 × 1024 × $0.085
         = $22,548/month
Plus the SFU compute cost — a 4-core c6i.xlarge handles roughly 200 concurrent participants on mediasoup or LiveKit. For 5% of 1.2M hours / 730 hours-in-month / 4 participants-per-call, we need:
concurrent_calls = (60,000 / 730) × (1 / 4)
                ≈ 21 concurrent calls peak
concurrent_participants ≈ 82
sfu_compute = ceil(82 / 200) × 1 server × $0.20/hr × 730
            ≈ $146/month
Real-time-relay total: $1,296 + $22,548 + $146 ≈ $23,990/month. Per viewer-hour (across all 1.2M hours, since the cost-per-MAU view is the operating one): $0.020 / hr. Per WebRTC user-hour specifically: $0.40 / hr — 20 to 200 times the cost of a comparable HLS hour. This ratio is the single largest "watch out" number in the article.
Line 8 — Engineering and operations
A team that ships and operates the seven lines above at this scale comprises, at minimum: one backend / streaming engineer, one DevOps / SRE, one frontend / player engineer, plus a quarter of a product manager and a quarter of a designer. Loaded cost in a senior North American or Western European market is $200–280k per FTE per year; in a high-quality near-shore or Eastern European market it is $80–120k per FTE per year. Run the model with a blended $140k loaded cost per FTE (reflecting a typical Fora Soft–style hybrid distribution):
fte_cost = (1 + 1 + 1 + 0.25 + 0.25) × $140,000 / 12
         = 3.5 × $11,667
         = $40,833/month
Plus monitoring stack (Datadog at $3,500/month for this footprint), incident-response tooling, AWS Business Support contract at 10% of AWS spend up to $5,000/month minimum, and a small contingency for one production outage every 90 days at $4,000 of engineering plus partner-credit reach-outs ≈ $1,300/month amortised. Engineering line total: ~$50,000/month. Per viewer-hour: $0.042 / hr.
The all-in bill
Stacking the eight lines:
| Line | Monthly cost | Per viewer-hour | % of bill |
|---|---|---|---|
| 1. Encoding | $1,670 | $0.0014 | 1.3% |
| 2. Packaging | $0 | $0 | 0% |
| 3. Storage + origin egress | $4,314 | $0.0036 | 3.5% |
| 4. CDN delivery | $27,208 | $0.0227 | 21.9% |
| 5. DRM | $3,360 | $0.0028 | 2.7% |
| 6. Analytics | $9,600 | $0.0080 | 7.7% |
| 7. Real-time relays | $23,990 | $0.0200 | 19.3% |
| 8. Engineering & ops | $50,000 | $0.0417 | 40.3% |
| Total | $124,142 | $0.1035 / hr | 100% |
 Figure 2. The eight-line bill at 100k MAU on a hybrid live + VOD product — engineering and CDN dominate, with real-time relays in third place because of the 5% WebRTC interactive layer.
How the curve bends with scale
The headline question every cost deck has to answer: what does the same product look like at ten thousand MAU, at one million, at ten million? Different lines scale differently, so the curve bends in non-obvious ways.
Encoding is roughly flat with library growth, linear with new live channel-hours, and largely insensitive to MAU. A library that takes 6,000 hours of source today still takes the same encoder pass at 10× users — the cost-per-viewer-hour for the encoding line drops by 10×.
Storage is flat with MAU, linear with library size. Same shape as encoding: per-viewer-hour cost drops as users scale on a fixed library.
Origin egress is linear with egress demand but dampened by cache hit ratio. At 10× scale, the cache hit ratio rises (the long-tail content gets warmer because more concurrent viewers share the same hot set), so origin egress per viewer-hour drops by roughly 25% as you cross from 100k to 1M MAU.
CDN delivery is linear with bytes shipped, but the per-GB price drops in tiers. At 1M MAU on the same engagement profile, the egress demand becomes 21,000 TB/month. CloudFront's published tier crosses $0.020/GB at petabyte scale, and a committed contract at that volume lands around $0.006/GB blended. Per-viewer-hour cost of CDN drops by roughly 50% from 100k to 1M MAU — but only if you renegotiate the contract.
DRM is linear with protected-license requests, with tier discounts. At 1M MAU and 16.8M licenses/month, a tiered SaaS rate lands around $0.0008/license; the line scales sub-linearly. Per viewer-hour drops by roughly 60%.
Analytics is linear with viewer-hours, with tier discounts. At 12M view-hours/month, a negotiated commit lands at $0.003 per hour; per viewer-hour drops by roughly 60%. This is the line most likely to flip from "shocking" at 100k MAU to "boring" at 1M MAU.
Real-time relays are linear with WebRTC-user-hours, with no tier discount unless you negotiate IP transit directly. The line scales worst of all because the cost is dominated by bandwidth, and bandwidth at scale only drops if you build your own peering. Per viewer-hour stays roughly flat.
Engineering is roughly logarithmic with MAU — the team that operates 10k MAU and the team that operates 1M MAU are the same five-to-eight people if the architecture is right, and only doubles past 10M MAU. Per viewer-hour drops by almost 10× between 100k and 1M MAU. This is the single biggest reason cost-per-viewer-hour falls sharply between $100k and $1M MAU and then flattens out.
| MAU | Monthly bill | Per-viewer-hour | Per-MAU | Per-MAU year |
|---|---|---|---|---|
| 10,000 | $58,200 | $0.485 | $5.82 | $69.84 |
| 100,000 | $124,142 | $0.103 | $1.24 | $14.90 |
| 1,000,000 | $580,000 | $0.048 | $0.58 | $6.96 |
| 10,000,000 | $4,400,000 | $0.037 | $0.44 | $5.28 |
 Figure 3. Cost per viewer-hour against scale, log-log — the elbow between 100k and 1M MAU is where most discount tiers kick in. Below the elbow, engineering dominates; above it, CDN dominates.
Build versus buy: the crossover for every line
Each of the eight lines has a buy-it option, a build-it option, and a crossover MAU above which build-it usually wins. The crossover is decided by two ratios: how much of the workload is generic (so a SaaS vendor amortises across many customers) versus product-specific (so the work has to live in your own engineering team anyway), and how many engineering FTEs the build-it path actually costs.
Encoding. Buy SaaS (MediaConvert, Bitmovin Encoding, Mux Encoding) until you're encoding more than ~5,000 hours of content per month or running more than 30 concurrent live channels. Beyond that, a Kubernetes-orchestrated FFmpeg / SVT-AV1 farm on spot instances is 60–80% cheaper at the raw bytes level but adds 1.5–2.0 FTE of engineering. Crossover: ~$25,000/month of SaaS encoding spend.
Packaging. Buy bundled. Building a CMAF packager from scratch saves no real money and adds rare-but-painful bugs around segment boundary alignment, init-segment regeneration, and DRM key insertion.
Origin. Buy managed (S3, Cloud Storage, Wasabi, Backblaze B2) at every scale. Building a self-hosted origin saves single-digit percent at the cost of multiple FTE-hours per quarter of operational firefighting.
CDN. Buy commercial CDN until you cross ~$200,000/month of CDN spend, at which point a build-your-own caching layer on top of bare-metal nodes in three or four colocation facilities starts to pay back. Even then, most teams of this size run a hybrid — commercial CDN as the third tier, custom edge for the top-talker content. Crossover: ~$2M annual CDN spend.
DRM. Buy SaaS at every scale below ~10M licenses/month. Above that, a self-hosted Widevine / FairPlay / PlayReady license server triplet starts to pay back — but the FairPlay certificate dance with Apple, and the regulatory paperwork to qualify, are still operationally expensive. Crossover: ~$30,000/month of DRM SaaS spend.
Analytics. Buy SaaS until you cross ~$200,000/month of analytics spend, at which point a self-hosted Prometheus / ClickHouse / Grafana stack pays back. The stack is a 0.5–1 FTE engineering line for as long as it lives; vendors price below that for moderate volumes. Crossover: ~$200,000/month — far higher than most teams expect.
Real-time relays. Buy managed (Twilio, LiveKit Cloud, Daily, 100ms, Mux Real-Time) at low scale. Build (coturn on EC2 plus self-hosted mediasoup or LiveKit) at moderate scale, because the SaaS markup over raw bandwidth is 5–10× and the WebRTC line is dominated by bandwidth. Crossover is unusually low: ~$10,000/month of managed real-time spend.
Engineering. This line is the answer to "should we build the other seven?" — not a line you choose to buy or build. The build crossovers above assume you can find and retain the FTEs at the loaded cost noted earlier; if you cannot, every crossover moves higher.
| Line | Crossover (monthly SaaS spend) | Build payback FTE-months |
|---|---|---|
| Encoding | $25,000 | 12–18 |
| Packaging | n/a — never build | n/a |
| Origin / storage | n/a — never build | n/a |
| CDN | $200,000 | 24–36 |
| DRM | $30,000 | 9–12 (plus regulatory) |
| Analytics | $200,000 | 9–12 |
| Real-time relays | $10,000 | 6–9 |
| Engineering | n/a | n/a |
 Figure 4. Build-versus-buy crossover by line. Real-time relays cross over first because raw bandwidth is the dominant cost and SaaS markups over bandwidth are unforgiving. CDN crosses over last because the commercial CDN market is the most competitive.
Pitfalls: the three lines almost every model gets wrong
If the model above tells you anything is more expensive than CDN, you should double-check it — and then trust it. Three lines look small on the slide and explode on the bill.
Pitfall 1 — Analytics meter mismatch. A subscription product with a five-hour-per-MAU monthly engagement profile pays 5× the analytics bill of an ad-supported product with one-hour monthly engagement, on the same MAU. The mistake is forecasting the analytics line off MAU instead of viewer-hours. Always model analytics from the engagement curve.
Pitfall 2 — Origin egress in multi-CDN. Switching from CloudFront-with-S3 to Cloudflare-with-S3 saves on edge egress and surprises you with $5,000–$30,000/month of new origin egress for which the original CloudFront quote had no equivalent line. The fix is to either run an origin shield, move the origin to a peered cloud-storage provider (R2 if you're on Cloudflare, B2 if you negotiate the Backblaze-Fastly transit deal, Wasabi if you pre-negotiate), or commit to keeping the origin in-cloud with the primary CDN.
Pitfall 3 — WebRTC bandwidth at scale. Five percent WebRTC traffic on a 100k-MAU app is 19% of the bill in the worked example. Ten percent WebRTC on the same app would be 30%. Teams that build a "small interactive feature on top of the VOD library" frequently end up shipping a costlier product than a pure-conferencing product, because the VOD library hid how much the WebRTC line costs per user. Always model WebRTC traffic as a separate line, not as a flavour of CDN traffic — and aim TURN-relay-hit rates below 15% by investing in a TURN-bandwidth calculator before launch, not after.
Sensitivity: what moves the bill the most?
If you have to optimise one knob to move the bill, which one is it? A tornado-chart sensitivity analysis on the 100k-MAU model says: the average rendition bitrate. A 25% cut in average bitrate (e.g., shipping AV1 and dropping the 1080p high-quality rung) saves $6,800/month directly on CDN — 5.5% of the all-in bill — without touching anything else. That is per-title encoding territory; the technique is covered in the per-title and per-shot bitrate ladder article.
The second-strongest knob is the analytics rate: a renegotiation from $0.030/hour pay-as-you-go to $0.008/hour committed-use is a $26,400/month difference at this volume. The third is the CDN rate per GB on commit. The fourth is the WebRTC TURN-hit ratio (every 5% reduction saves about $1,000/month on real-time-relay).
The knobs that move the bill the least: storage tier (single-digit dollars per percent), packaging optimisation (already zero), and DRM provider switching at this volume (a few percent at best).
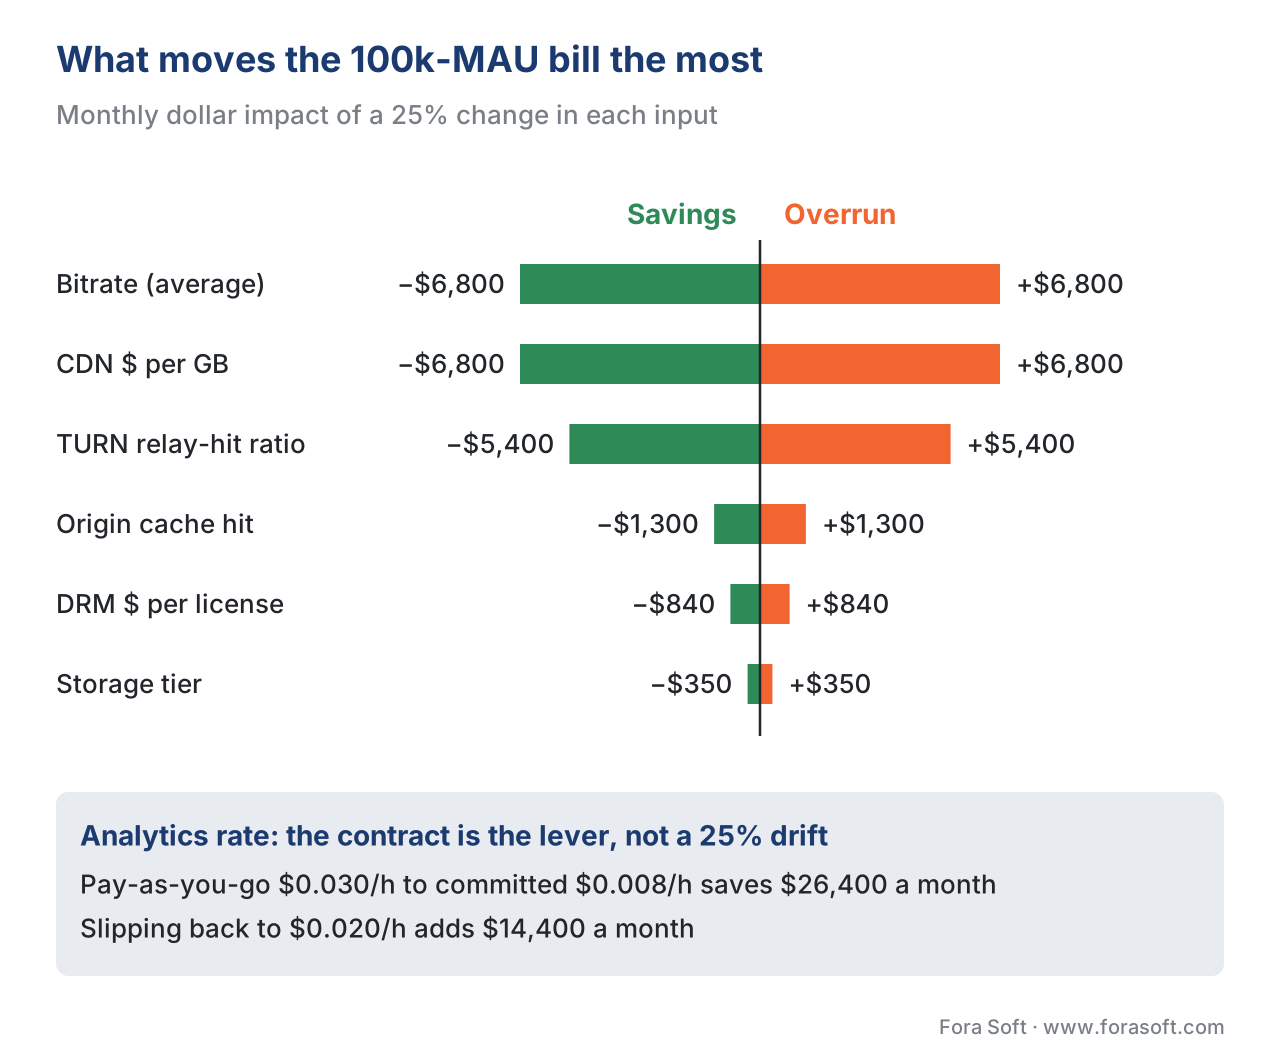 Figure 5. Sensitivity tornado for the 100k-MAU worked model. Average rendition bitrate is the most powerful single knob; storage tier is the least.
A common mistake: confusing concurrent viewers with MAU
The single most-common modelling mistake is mixing the concurrent peak with the monthly active figure. CDN sales reps quote off concurrent peak (because that drives the 95th-percentile bill and the burst-capacity provisioning). Product and finance teams forecast off MAU (because that drives revenue). The two are connected by an engagement-and-time-distribution model: typically, peak concurrent is 5–15% of MAU for a live-heavy product, and 0.5–2% of MAU for a VOD-only product, depending on the day-of-week and time-of-day distribution.
For the 100k-MAU worked model, with 30% live share and a Saturday-evening peak overlapping a single hero match, peak concurrent might be 4,000–8,000. The CDN's burst capacity has to be sized at 4,000 × 4 Mbps = 16 Gbps, even though average utilisation is closer to 6 Gbps. If the contract sizes the commit at the average, you pay overage every peak; if it sizes at the peak, you pay for headroom you don't use most of the month. The correct contract sizes commit slightly below average and structures overage carefully — covered in the CDN cost economics article.
Free download: Streaming Cost Model WorksheetOne printable page with the eight cost lines, the unit conversions from bitrate to GB and viewer-hours, the 100k-MAU benchmark numbers and the sensitivity table, ready to copy into your own model.Where Fora Soft fits in
We have built and operated streaming products in this cost regime since 2005 — across video conferencing, OTT, telemedicine, e-learning, surveillance, and AR/VR — and the eight-line model above is the one we used to design the architecture and to negotiate the vendor contracts on most of the 239+ projects we have shipped. Where teams typically engage with us is at the elbow of the cost curve: a product that has crossed 50,000–100,000 MAU, is feeling the analytics and CDN bills bite, and needs an architecture review that translates into renegotiated commits, a different ladder strategy, or a build-versus-buy decision on real-time relays. We do not sell the SaaS components in the model — we are the team that helps you choose between them and operate them, and we cross-link the video-streaming services page for engagements that need an architectural partner end-to-end, and run an independent architecture review when the bill is the first symptom.

The book
Video Streaming: A Complete Guide to Video Delivery: From ABR and CDNs to Players, WebRTC, DRM, and the Economics of Streaming
This article prices one product at one scale. Book 3 takes apart each line of that bill: how the bitrate ladder and ABR set the bytes you ship, how CDN caching, commits and multi-CDN set the price per GB, what WebRTC relays and multi-DRM licensing really cost, and how the economics of delivery change as you grow. Written by Nikolay Sapunov, CEO at Fora Soft.
Is your streaming bill growing faster than your MAU?
Send us your monthly bill split into the eight lines, with MAU, viewing hours and bitrate. We will find the two lines worth the next quarter of work, whether that is a CDN commit, the analytics contract, the bitrate ladder or a build-versus-buy call on real-time relays. 250+ video products shipped since 2005.
See our case studies
Case study
Perspire.tv
Live fitness classes, an on-demand library and 1:1 WebRTC training on LiveKit in one product: the same hybrid live, VOD and real-time mix as the worked model.
Case study
Sprii
Live shopping for 3,000+ brands and 72,000+ live events, delivered on Cloudflare and Hetzner: infrastructure picked with the delivery bill in mind.
Case study
Worldcast Live
HD concerts at 0.4–0.5 s latency for 10,000 simultaneous viewers at 1.5 Gb/s over WebRTC, where the real-time relay line decides the cost of every show.
What to read next
CDN
CDN Cost Economics: 95th-Percentile, Commit, Overage, Transit
The deep dive on the second-largest line in this model.
ABR
Building a Bitrate Ladder: Classic Netflix Ladder, Per-Title, Per-Shot
The strongest knob in the sensitivity analysis.
Calculator
TURN Bandwidth Calculator: What Your WebRTC Relay Traffic Actually Costs
Size the real-time relay line before launch, not after.
Calculator
Multi-DRM Cost Calculator: What Widevine, FairPlay, and PlayReady Actually Cost You
Put your own license volume into the DRM line.
References
- AWS Elemental MediaConvert pricing page, May 2026 — published per-minute output rates for SD ($0.0075), HD ($0.0150), UHD ($0.0300) and tier-discount structure. https://aws.amazon.com/mediaconvert/pricing/
- AWS Elemental MediaLive pricing page, May 2026 — published per-hour live channel rates for HD input ($0.7656) and UHD input ($1.7225), with 12-month reserved-commit discount up to 75%. https://aws.amazon.com/medialive/pricing/
- Amazon S3 pricing page, May 2026 — Standard tier $0.023/GB-month, Standard-IA $0.0125/GB-month, Glacier Instant Retrieval $0.0036/GB-month; egress rates $0.04/GB regional, $0.05–0.09/GB internet. https://aws.amazon.com/s3/pricing/
- Amazon CloudFront pricing page, May 2026 — per-GB tiered pricing in US/EU starting at $0.085/GB and tapering to $0.020/GB at petabyte scale; HTTP/HTTPS request pricing at $0.0075 / $0.010 per 10k. https://aws.amazon.com/cloudfront/pricing/
- Mux pricing page, May 2026 — DRM add-on at $100/month base + $0.003 per license; Mux Data analytics tiers around $0.0005–$0.0008 per viewer-minute. https://www.mux.com/pricing
- EZDRM service pricing summary, May 2026 — entry plan from $199.99/month for Widevine + FairPlay + PlayReady SaaS license server. https://www.ezdrm.com/service-pricing
- doverunner pricing page, May 2026 — Standard plan $299 for first 1,000 users, then $0.06/user (1,000–10,000) and $0.04/user above 10,000 — taken as the representative non-Mux per-user DRM rate card. https://doverunner.com/pricing/
- Bitmovin Video Developer Report 2025/26 — cost control named the number-one challenge by 38% of video developers surveyed; basis for the framing of the "Why this matters" section. https://bitmovin.com/video-developer-reports/
- Conviva: OTT 101 — Your Guide to Streaming Metrics that Matter, 2026 — definitions of engagement, viewer-hour, and concurrent-peak metrics used as the baseline of the worked model. https://www.conviva.ai/resource/ott-101-your-guide-to-streaming-metrics-that-matter/
- MwareTV: OTT Streaming Service Costs 2026 — Complete Launch Budget Guide — competitive industry-survey article verifying order-of-magnitude figures used for the 100k-MAU worked example. https://mwaretv.com/en/blog/ott-streaming-costs-guide
- NewscastStudio: Streaming vendors see cost control and AI deployment as dual priorities for 2026 — industry survey corroborating the cost-control framing. https://www.newscaststudio.com/2026/01/01/streaming-vendors-see-cost-control-and-ai-deployment-as-dual-priorities-for-2026/
- Spendark: Video Streaming Cloud Costs — AWS, Azure, GCP Pricing (2026) — cross-cloud egress and managed-service unit-pricing benchmark used as a consistency check on the model's line-by-line figures. https://spendark.com/blog/video-streaming-cloud-cost/
