

Key takeaways
• One right-click, ten named problems. Right-click a participant’s video in Chrome 116+, choose Test stream, and StreamTest turns “the video froze” into a named problem with a start time, a duration, a severity and a short list of things to check.
• Four owners instead of one mystery. Every problem is tagged Network, Sender, Page or Device, so the ticket lands with the team that can fix it the first time.
• The numbers are the viewer’s numbers. Frame rate counts frames painted on screen, not frames decoded. Delay is split into network, jitter buffer and decode. Freezes and stalls use the gap rule from the W3C statistics spec: max(3 × frame interval, interval + 150 ms).
• Validated on our own fault-injection stand. In the final validation, 15 scenario checks were each run 10 times without retries, and every run named the right problem and the right cause: 150 out of 150.
• Free, local and ticket-ready. No account, no server, nothing leaves the browser. Copy summary plus a JSON export give a developer enough to start debugging without a call.
A customer writes in: “the video froze.” By the time anyone opens chrome://webrtc-internals, the freeze is over, the graphs have scrolled away, and nobody wrote down the second it happened. So the ticket bounces. The network team says it’s the app, the front-end team says it’s the network, and a two-minute glitch eats a week of Slack threads.
StreamTest is the WebRTC troubleshooter we built at Fora Soft to end that loop. It’s a free Chrome extension: right-click the participant’s video, choose Test stream, and it watches that one received stream second by second. When something breaks, it names the problem, dates it, grades it, says whose side it’s on and what to check first.
This guide is the full manual. You’ll run a first test in ten seconds, learn to read the panel, the Timeline and the Report, get all ten problem types with the exact rule behind each, and see where in your stack each fix usually lives. It’s written for QA engineers, developers and support teams on video calling, live streaming and telemedicine products.
Why we built StreamTest
We’ve built video and real-time software since 2005: 250+ projects, about 50 engineers, and a lot of WebRTC running in production. That includes BrainCert’s virtual classroom with 500M+ real-time classroom minutes, TransLinguist’s interpretation platform, which won the UK’s NHS national framework for language services, and ProVideoMeeting, a conferencing product with SIP dial-in. Different products, same most-expensive ticket: “the video froze.”
It’s expensive because one symptom hides many causes. A frozen picture can be packet loss on hotel Wi-Fi, a sender whose CPU gave up, a TURN relay on another continent, a decoder falling behind, or a page whose main thread was busy re-rendering the participant grid. Each cause has a different owner and a different fix. And the evidence sits on the receiving side, the one place nobody is recording.
chrome://webrtc-internals has every counter you could want, but it’s built for WebRTC experts who already know what they’re looking for. We wanted a tool that a QA engineer, a support agent and a customer on the phone could all run, and that answers in words. So we built StreamTest as a WebRTC troubleshooter anyone on the team can run, validated every detector on a test stand, and put it on the Chrome Web Store for free.
Its thresholds are the same ones we publish in our guide to testing WebRTC stream quality. That guide tells you which metrics matter and where the lines are; this one shows you how to catch them live with one tool. And when a StreamTest card points past the browser, at your SFU, your TURN servers or your encoder settings, you’re in the territory our WebRTC development team works in every day.
Got a “video froze” ticket nobody can close?
Send us the ticket, or a StreamTest JSON if you have one. In 30 minutes we’ll tell you which SFU, TURN or encoder setting to change first, and what the fix involves.
Your first test in ten seconds
A test takes one right-click: join the call, right-click the participant you want to check, choose Test stream. The rest of this section is about doing that on the right page and the right video.
Install the WebRTC troubleshooter and check where it runs
Install StreamTest from the Chrome Web Store listing. It needs Chrome 116 or newer and no account, server or sign-up; version 2.0.0 (September 2026) weighs 147 KiB. It works on:
- any
https://page: production video apps, staging, demo environments; - the root page of an
http://site; http://localhostandhttp://127.0.0.1with any path, so developers can test a build running on their own machine.
Run your first test
- Open the call and wait until the other participant’s video is playing.
- Right-click that participant’s video, or tap the touchpad with two fingers over it.
- Choose Test stream in the context menu.
- The StreamTest panel opens in the top-right corner and shows
Collecting data…for five seconds. After that the status row readsNo problems · 0:05or names the problem that’s happening.
StreamTest finds the video by the point you clicked, not by the element under the pointer. A name badge or a mute icon drawn over the tile doesn’t get in the way. To test someone else, right-click their tile and choose Test stream again: the running session stops and becomes the “previous run” the Report compares against.
Three habits that save a failed start
- Load the page with StreamTest already on. The extension hooks WebRTC connections as the page loads. If you installed it mid-call, reload the page and rejoin.
- Test a received stream, not your own preview. Your camera preview has no incoming connection behind it, so there’s nothing to measure.
- Open embedded calls in their own tab. StreamTest reads the top-level page. If the call lives in an iframe from another site, open the iframe’s address directly.
Pick the panel size for the job
| Mode | Size | Use it when |
|---|---|---|
| Mini | 190 px wide | You want the seven numbers and a status dot in a corner during a long call |
| Compact | 350 px wide | Default view: status row, seven metric tiles with 2-minute sparklines, codecs, connection type, Mark |
| Expanded | 900 × 700 px | You’re investigating: the Timeline and Report tabs |
Drag the panel by its header to move it off the video. StreamTest remembers the last mode and opens the next session in it, and the toolbar button shows or hides the panel. Closing the panel stops the session but keeps its data in the page: until you leave, the start screen offers the Last session with Open report and Export JSON.
Reading the live panel
The Compact panel answers one question at a glance: is this stream fine right now? The status row answers in words, seven tiles answer in numbers, and every number is green, yellow or red against a fixed threshold.
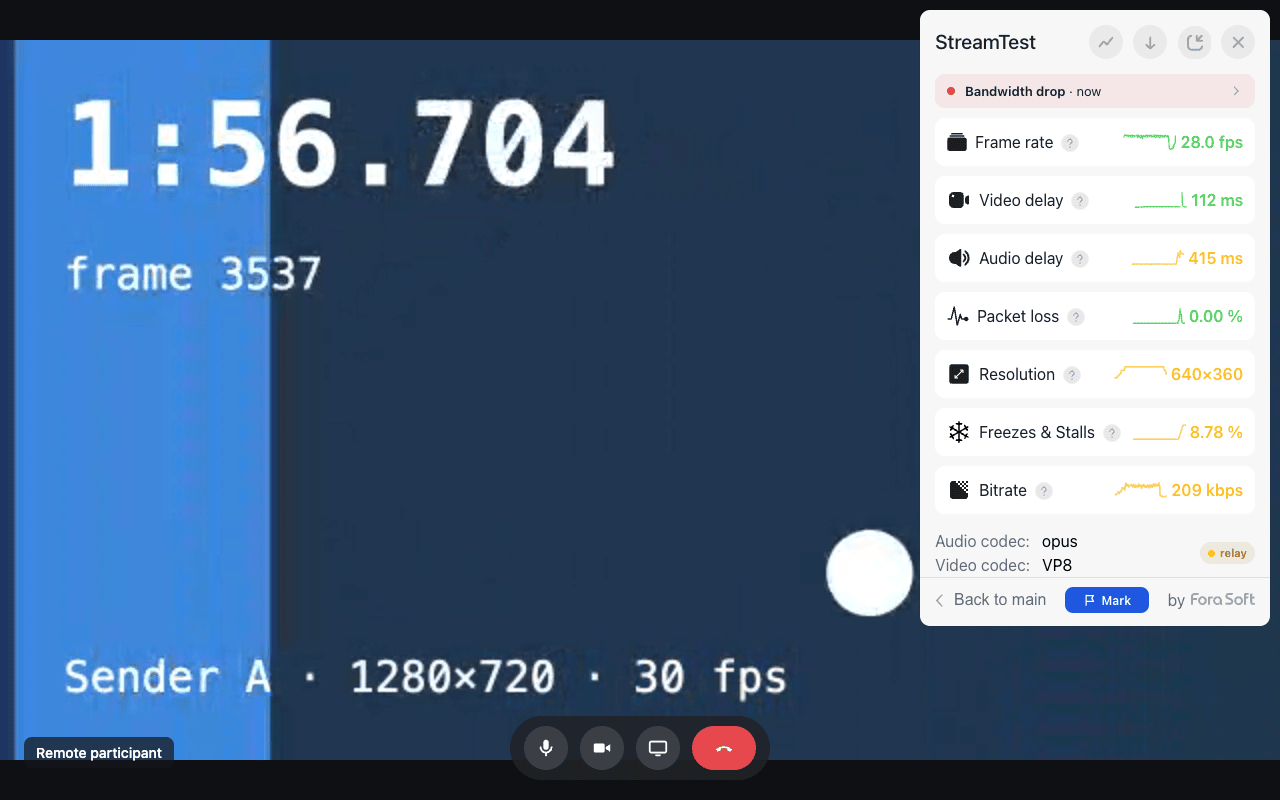
Figure 1. The Compact panel during a bandwidth drop: the status row names the problem, bitrate and resolution turn yellow, and the chip shows the call runs through a TURN relay.
The status row
| The row says | What it means |
|---|---|
Collecting data… | The first five seconds: too little data to judge |
No problems · 2:00 | Nothing detected since the session started |
Bandwidth drop · now | A problem is happening right now; yellow is a warning, red is severe |
3 problems · last 76s ago | Problems happened but none is active; the color is the worst one’s |
Stream disconnected · 2:14 | The stream ended; everything recorded is kept |
Click the row to jump straight to the Report.
The seven tiles and their thresholds
Each tile has a 2-minute sparkline next to its value, so you see the trend, not just the current second. Frame rate updates four times a second, everything else once a second.
| Tile | What it measures | Green | Yellow | Red |
|---|---|---|---|---|
| Frame rate | Frames actually painted on screen per second | ≥ 24 fps | 15–24 fps | < 15 fps |
| Video delay | Half the round trip + jitter buffer + decode + render | < 300 ms | 300–1,000 ms | > 1,000 ms |
| Audio delay | Half the round trip + audio jitter buffer | < 300 ms | 300–1,000 ms | > 1,000 ms |
| Packet loss | Share of video packets lost over the last 5 s | < 1 % | 1–5 % | > 5 % |
| Resolution | Decoded frame size against the video element on the page | At least element ÷ 1.2 | In between | Below element ÷ 2.4 |
| Freezes & Stalls | Share of session time the picture stood still | < 1 % | 1–10 % | > 10 % |
| Bitrate | Video kilobits received per second | By frame height | By frame height | By frame height |
Bitrate is judged against the frame height, because 600 kbps is plenty for 360p and starvation for 1080p:
| Frame height | Green from | Red below |
|---|---|---|
| Under 480p | 700 kbps | 200 kbps |
| 480p–719p | 1,200 kbps | 400 kbps |
| 720p–1079p | 2,000 kbps | 500 kbps |
| 1080p and up | 2,000 kbps | 1,000 kbps |
Three details a raw getStats() dump won’t give you
- Frame rate is what the viewer sees. StreamTest counts frames through
requestVideoFrameCallback, so only frames that reached the screen count. A decoder can report 30 fps while the screen shows 12. - Resolution is relative. 640×360 is perfect in a thumbnail and blurry in a full-screen tile, so the tile compares the stream with the element it’s drawn in.
- A freeze is measured, not guessed. A gap counts when the next frame is later than three average frame intervals or the average plus 150 ms, whichever is longer. That’s the same rule the W3C spec uses for
totalFreezesDuration. Gaps under a second only add to the percentage; longer ones become a Video freeze problem.
Worked example: from raw numbers to colors
Here’s the arithmetic behind Figure 1. The remote tile is drawn at 1280×720 on the page. Green resolution needs at least 1280 ÷ 1.2 by 720 ÷ 1.2, which is 1067×600. Red starts below 1280 ÷ 2.4 by 720 ÷ 2.4, which is 533×300. The stream arrives at 640×360: under 600 lines, over 300, so the tile is yellow.
Bitrate next. A 360-line frame falls in the under-480p band, where green starts at 700 kbps and red begins below 200. The panel shows 209 kbps: yellow, nine kilobits above red. And the freeze rule at 30 fps: the average frame interval is 1000 ÷ 30 ≈ 33 ms. Three intervals make 100 ms, the interval plus 150 ms makes 183 ms, so any gap longer than 183 ms counts as a stall. At 15 fps the bar moves to 217 ms, because a slower stream is allowed longer gaps.
A grey dash means there’s no data, and its tooltip says why. “Tab hidden — the browser does not render frames” and “Video paused — no frames to render” are the common ones; those seconds never count as freezes.
Codecs and the connection chip
Under the tiles sit the audio and video codecs and a chip with the connection path. Hover it to see the local and remote candidates and, if there is one, the TURN server. If the candidate types are new to you, our NAT, STUN, TURN and ICE explainer covers them in ten minutes.
| Chip | Meaning | Color |
|---|---|---|
host / srflx | Direct path: a local address or the public address found through STUN | Green |
relay over UDP | Media goes through a TURN server | Yellow |
relay over TCP or TLS | UDP is blocked; lost packets are retransmitted by TCP and delay grows | Red |
Mark the moment
The blue Mark button drops a numbered flag on the timeline at the current second. The header holds four more buttons: Open timeline, Download logs (saves the full JSON at once), Resize (Mini ↔ Compact) and Close.
Reach for Mark when: a tester sees a glitch or a user on the phone says “it froze just now.” One click flags that second on the timeline, in the copied summary and in both export files, so “Mark 2 at 1:14” means the same thing to everyone who reads the ticket.
The Timeline and the problem card
The Timeline puts bitrate, frame rate, packet loss and delay on one time axis, so a cause shows up as several lines moving in the same second. Open it with the chart button in the panel header or by clicking the connection chip.
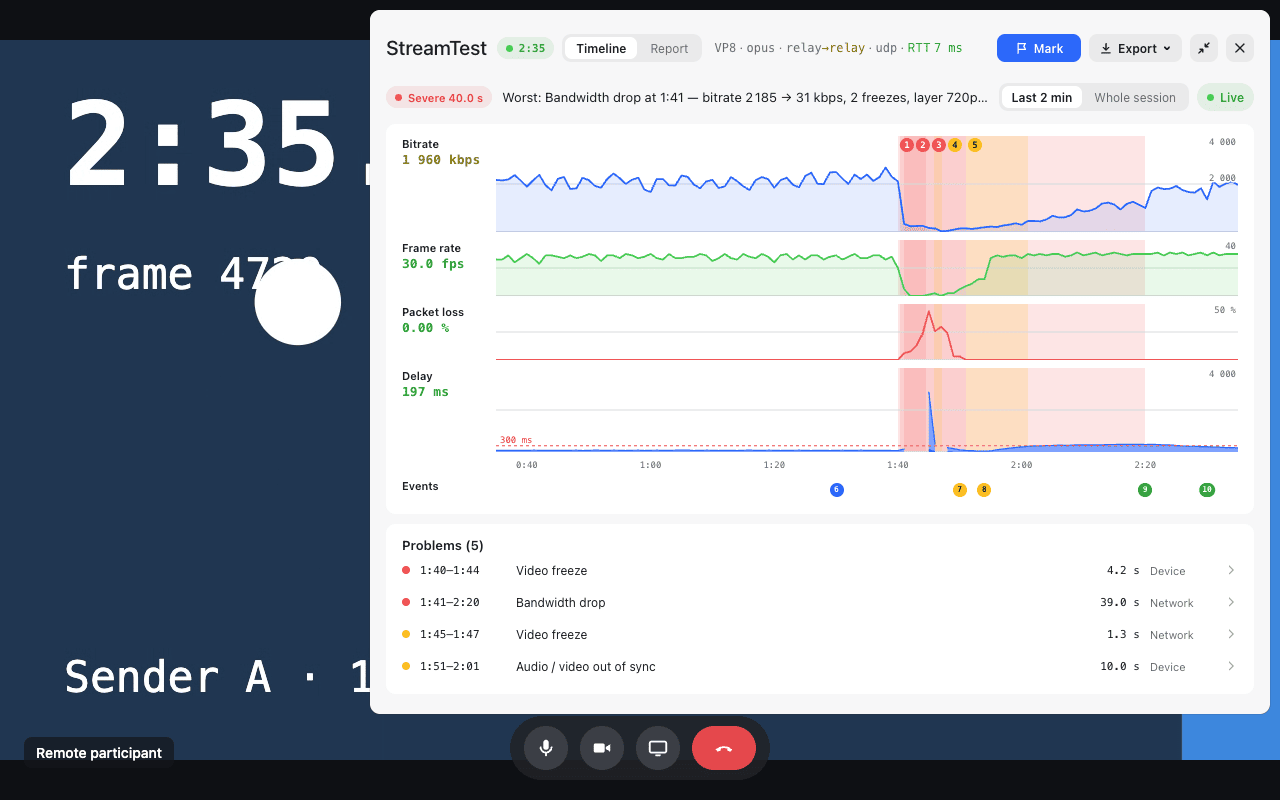
Figure 2. A 10-second throttle to 300 kbit/s: bitrate collapses, loss spikes, frame rate hits zero, and the problems line up under one red band.
What’s on the screen
- Verdict row. A chip (
OK,Degraded 9.7 sorSevere 40.0 s) with the seconds the stream was degraded, then the worst problem in one line: “Worst: Bandwidth drop at 1:41 — bitrate 2185 → 31 kbps, 2 freezes, layer 720p → 360p”. - Window and Live.
Last 2 minfollows the call;Whole sessionshows everything recorded, up to 60 minutes. Dragging a chart pauses Live, and the Live toggle brings you back to now. - Four charts. Bitrate, with a dashed line for Chrome’s estimate of the incoming channel when Chrome reports it; frame rate; packet loss; and delay as a stack of network, jitter buffer and decode + render, with a red line at 300 ms.
- Problem bands. Every problem is a numbered vertical band across all four charts: yellow for warnings, red for severe. Grey bands mark seconds when the tab was hidden or the video paused.
- Events band. Numbered circles for the first frame, resolution changes (
720p → 360p), path changes (Path → relay),Reconnected,Tab hidden/Tab visibleand your marks. - Problems list. Start and end time, title, duration and category (Network, Sender, Page, Device) for every problem, newest at the bottom.
Hover anywhere on the charts for a cursor through all four rows. The tooltip lists every value at that second, including the delay breakdown: “Delay 412 ms — network 46 · buffer 310 · decode 56”.
Read the shapes before you read the cards
With a little practice you can name the cause from the chart shapes alone. These are the patterns our engineers look for first:
| On the timeline | Usually means |
|---|---|
| Bitrate falls, loss spikes, delay climbs | Congestion between you and the sender |
| Bitrate falls with the dashed estimate, loss stays near zero | Congestion control backing off before loss: a slower link or a capped uplink |
| Frame rate drops, bitrate and loss stay flat | The page or this device: main thread, decoder, rendering |
| Delay grows in the buffer layer, network layer flat | Jitter: packets arrive unevenly and the buffer stretches to hide it |
| Delay grows in the network layer | Round trip grew: a route change, a relay, or a queue filling up |
| Everything drops to zero, then returns | Connection lost and re-established |
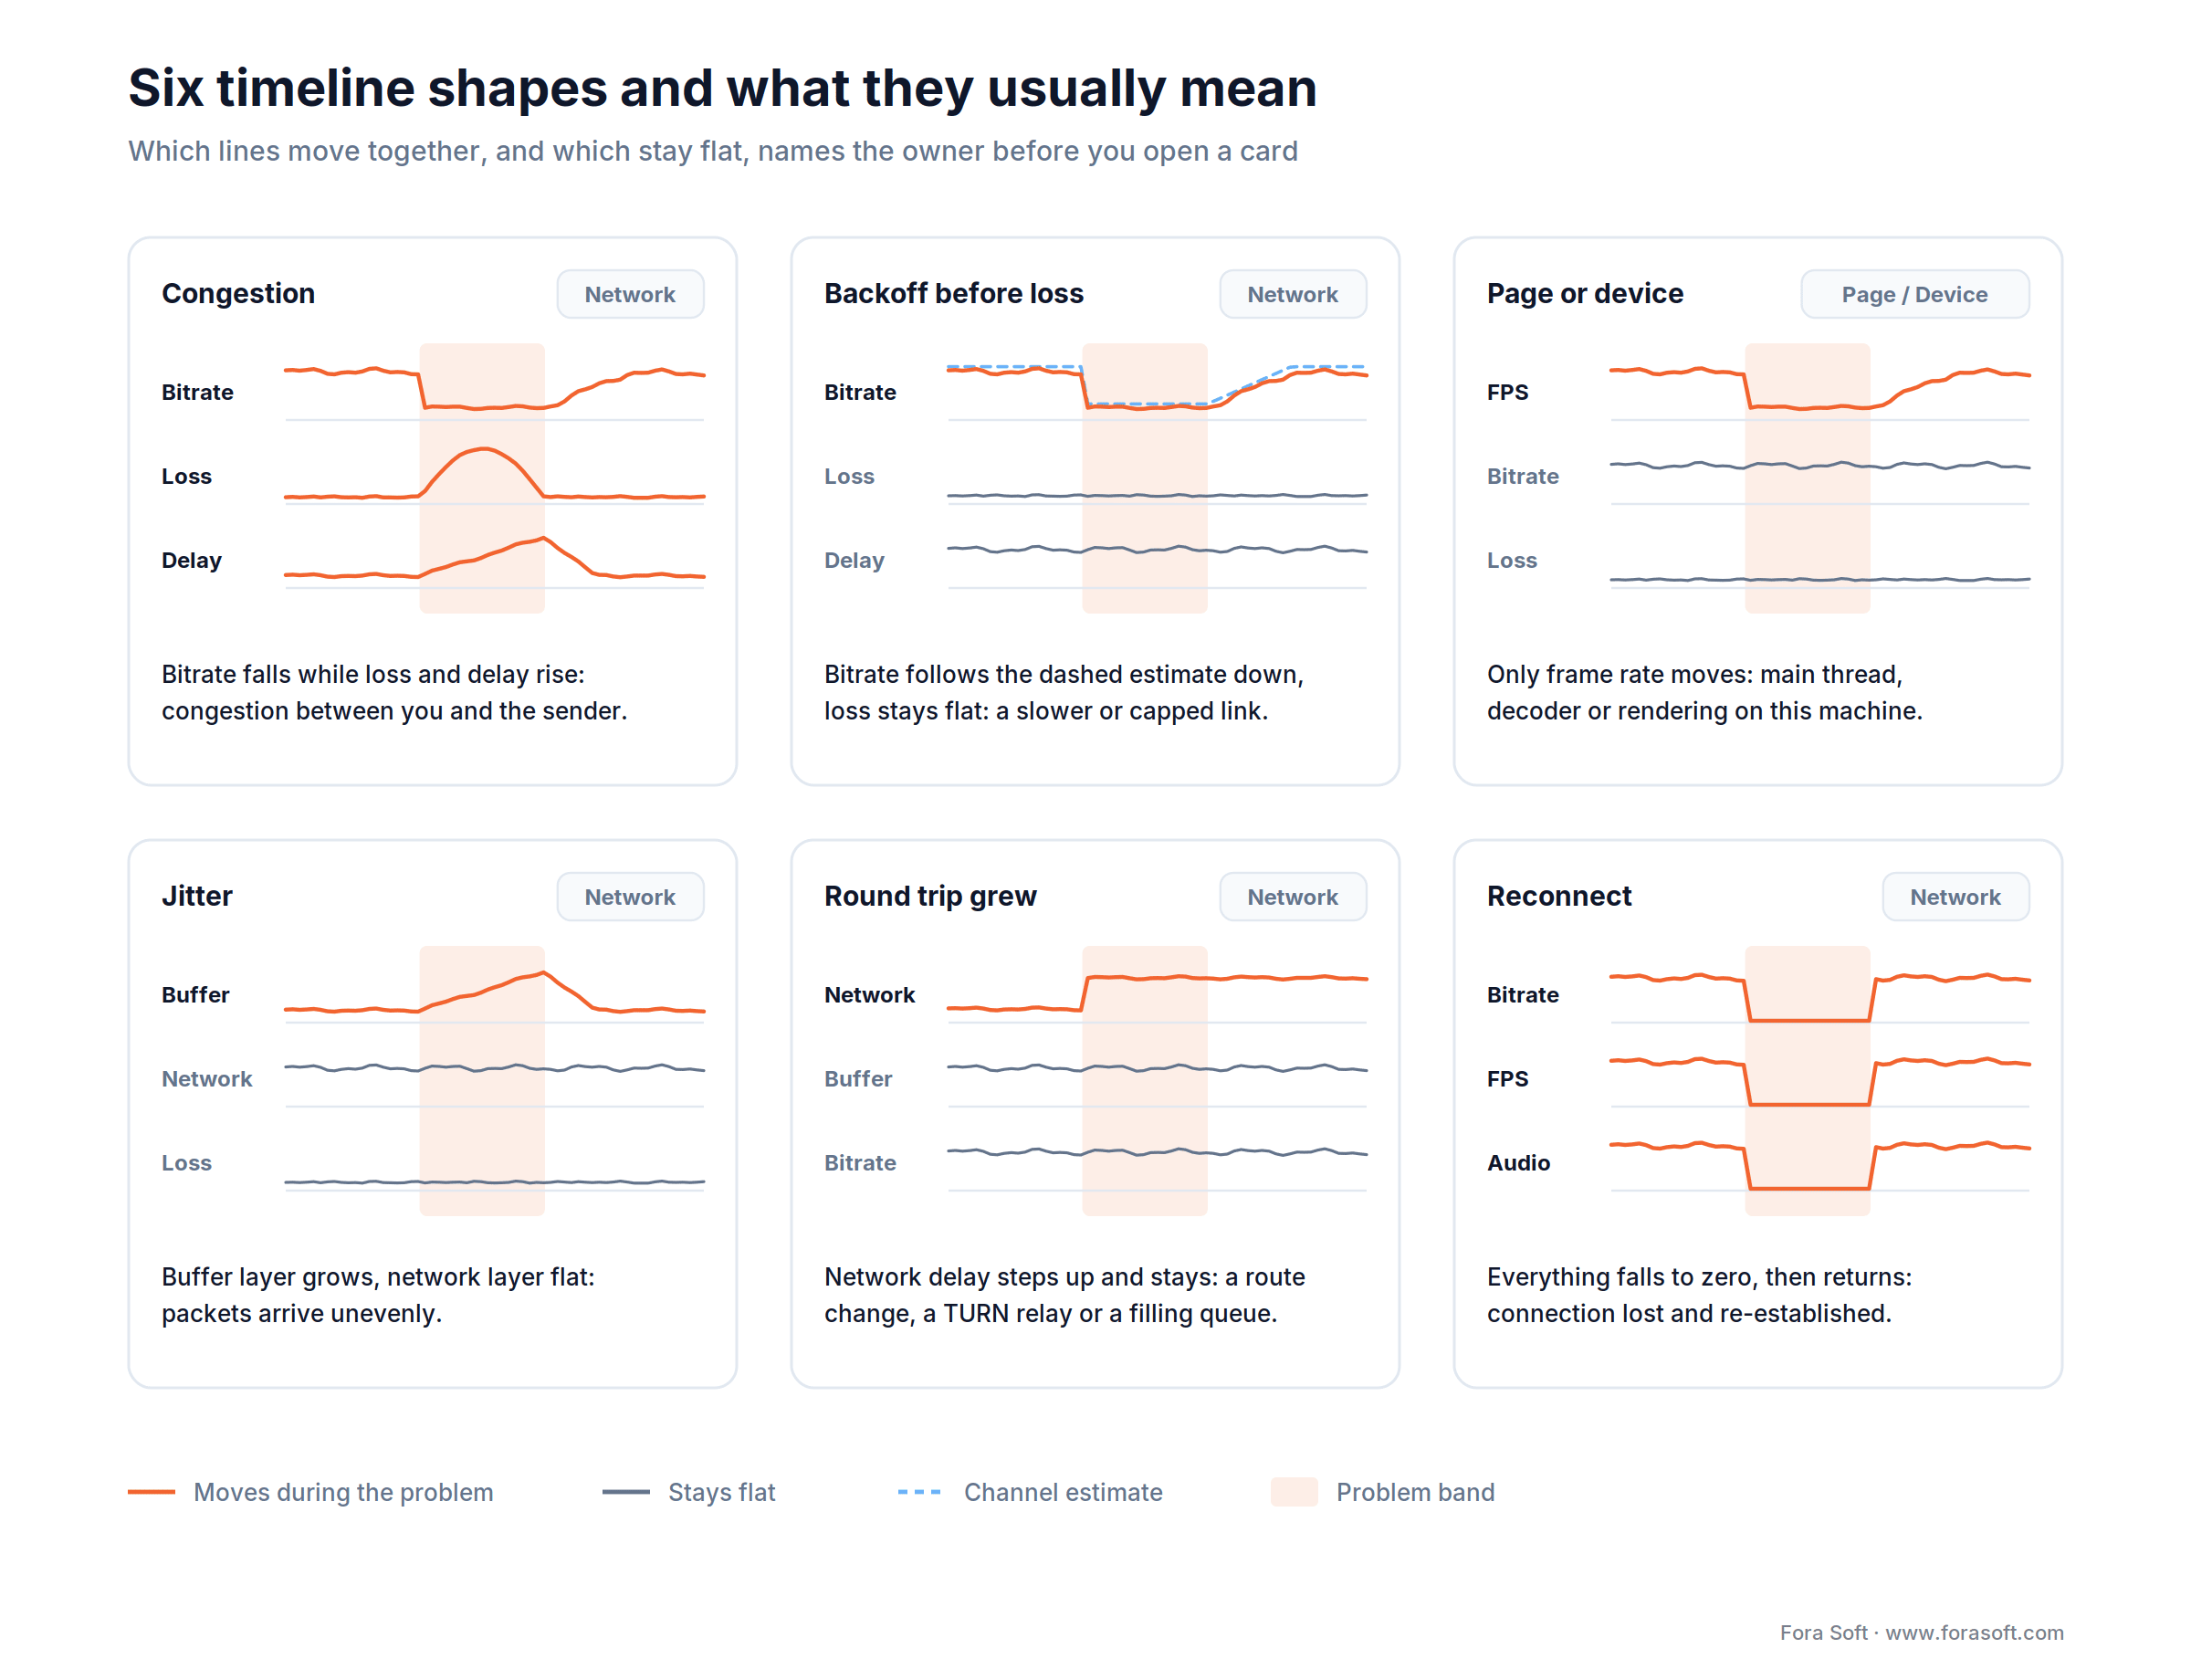
Figure 3. Six shapes worth memorizing. Which lines move together, and which stay flat, tells you the owner before you open a single card.
Anatomy of a problem card
Click a band, its number or a row in the list, and the card opens next to the charts. Every card has the same five parts, so once you can read one, you can read all ten.
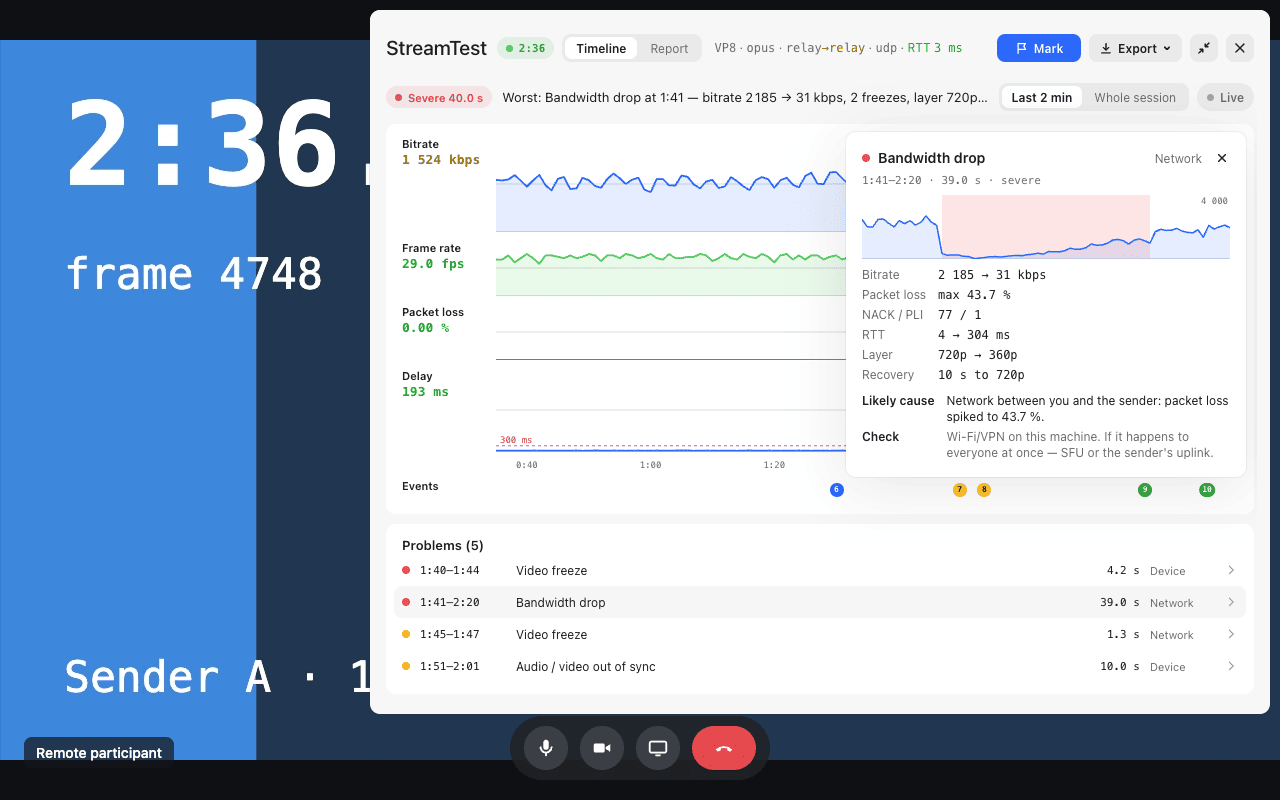
Figure 4. A severe Bandwidth drop: bitrate fell from 2,185 to 31 kbps, loss peaked at 43.7 %, the layer dropped from 720p to 360p and took 10 s to recover.
- Title and category. What happened and whose side it’s on: Network, Sender, Page or Device.
- Time line.
1:41–2:20 · 39.0 s · severe: start and end in session time, duration, severity. - Mini chart. The key metric from 15 s before to 15 s after the problem, so you see the “before” as well as the “during.”
- Evidence rows. Three to six numbers that prove the diagnosis: before → during values, NACK and PLI counts, layer changes, recovery time.
- Likely cause and Check. The verdict in one sentence with the numbers filled in, then where to look first.
The texts are fixed templates, not free-form guesses: the same situation always produces the same words.
How StreamTest decides
Every problem gets a category that tells you whose side to look at and a severity that tells you how much it hurt. The session gets a one-word verdict. The rules are fixed, so everyone on the team reads the same result the same way.
Four categories, four owners
| Category | Where the problem is | Who usually owns the fix |
|---|---|---|
| Network | Between this browser and the sender: Wi-Fi, ISP, VPN, route, TURN relay | Network and infrastructure team, or the viewer’s connection |
| Sender | The sending side or the SFU: encoder, uplink, layer selection | Media server team, or the sender’s device |
| Page | The website’s own JavaScript blocking the main thread | Front-end team |
| Device | This computer: decoder, rendering, audio/video sync | Client team, or the viewer’s browser and hardware |
One exception to keep in mind: Your upload limited is a Sender problem about your outgoing video. In a two-way call you’re a sender too.
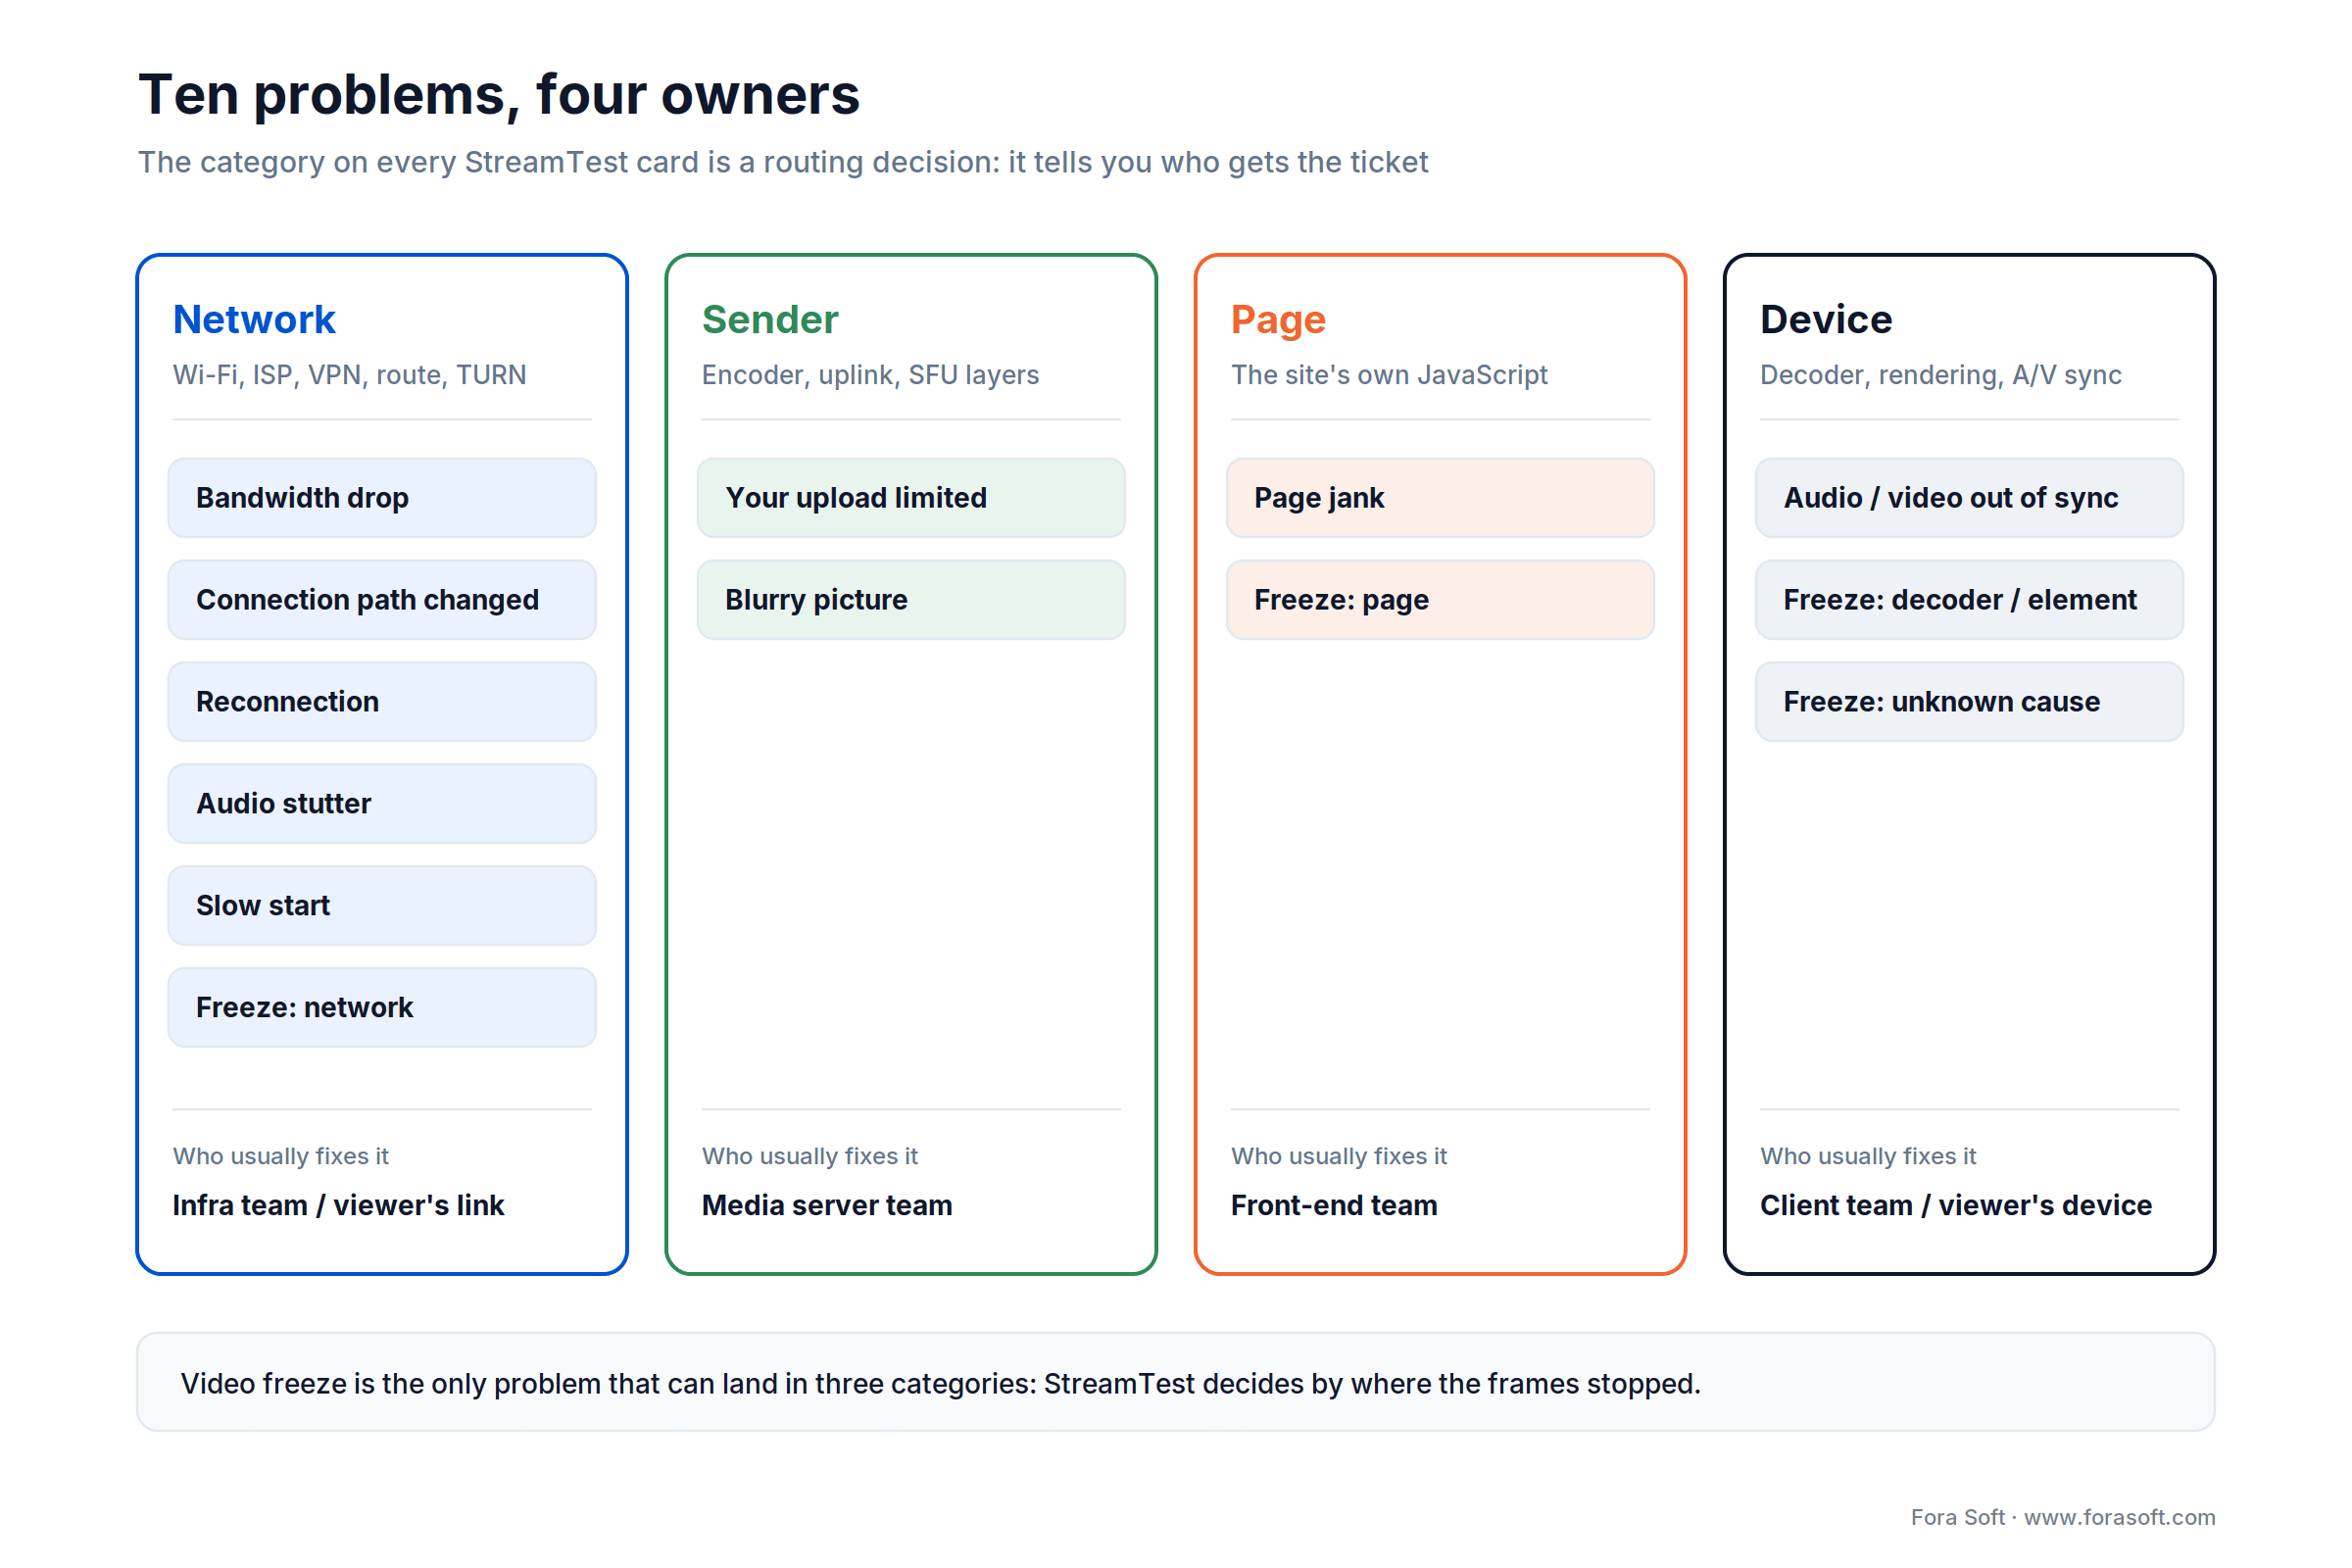
Figure 5. Ten problems, four owners. The category on each card is a routing decision: it tells you which team gets the ticket.
The verdict
| Verdict | When |
|---|---|
OK | No problems in the session |
Degraded 9.7 s | Only warnings |
Severe 40.0 s | At least one severe problem |
The number is how many seconds the viewer spent with at least one problem. Overlapping problems, like a freeze inside a bandwidth drop, count once. The Report adds who is to blame in plain words: Network, not the page., “The page or this device, not the network.” or Both network and this device..
Why fixed thresholds and no score
There’s no settings page on purpose: one tool, one bar for every tester, so two testers get the same result for the same stream, wherever they sit.
There’s also no 0–100 quality score. A score starts arguments about the formula. “40 seconds of severe degradation, network, not the page” starts a fix.
Detectors use hysteresis. Most problems open only when a condition holds for several seconds in a row, and close only after the stream has been back to normal for a few seconds. A single bad second doesn’t raise an alarm.
The ten problems at a glance
StreamTest detects ten types of problems. Anything shorter than one second is treated as a blip and never shown. A problem appears in the list within a few seconds of its condition, and its card keeps updating for 15 seconds after it ends.
| # | Problem | Category | Opens when | Severe when |
|---|---|---|---|---|
| 1 | Bandwidth drop | Network | Bitrate under 50 % of its 30-s median for 2 s, with loss ≥ 2 %, ≥ 2 keyframe requests in 5 s or a halved channel estimate | A freeze or a resolution drop happened inside it |
| 2 | Video freeze | Network, Page or Device | No new frame painted for 1 s or more | 3 s or longer |
| 3 | Page jank | Page | A main-thread task of 200 ms or more cuts frame rate below 70 % of normal while the network is fine | Always a warning |
| 4 | Connection path changed | Network | The connection switched to a TURN relay, or round-trip time grew 1.5× after a switch | Always a warning |
| 5 | Reconnection | Network | ICE went disconnected or failed after being connected | Always severe |
| 6 | Your upload limited by CPU / bandwidth | Sender | Your own outgoing video is limited by CPU or bandwidth for 3 s | Always a warning |
| 7 | Audio stutter | Network | More than 5 % of audio concealed over 5 s | Peak above 20 % |
| 8 | Audio / video out of sync | Device | Audio and video more than 200 ms apart for 3 s | Always a warning |
| 9 | Blurry picture | Sender | Compression (QP) in the red zone for 5 s while bitrate holds | Always a warning |
| 10 | Slow start | Network | First frame more than 4 s after the stream began | Later than 8 s, or no video in 15 s |
The next four sections take them in groups. Each entry follows the same path: what the viewer notices, the exact rule that opens the problem, what the card says, and where in your solution the fix usually lives.
Card points at your SFU, TURN or encoder?
That’s past the browser and into infrastructure. Book 30 minutes with our WebRTC engineers, bring the JSON export, and we’ll tell you which setting to change first.
Network drops and reconnects
Three of the five Network problems are about the connection itself: a bandwidth drop, a change of connection path and a full reconnection. They share one fast test. Run StreamTest on two participants at once: if both streams suffer in the same second, the fault is on the shared side, your SFU or the viewer’s own link; if only one does, look at that sender.
1. Bandwidth drop · Network
What the viewer notices. The picture turns soft or blocky, then often drops to a lower resolution. In bad cases it stutters and freezes.
How StreamTest catches it. Bitrate falls below half of its median for the previous 30 seconds, two seconds in a row. The network must show trouble in the same moment: packet loss of 2 % or more, at least two keyframe requests (PLI) in 5 seconds, or Chrome’s estimate of the incoming channel falling below half its median. The problem ends when bitrate is back to 80 % of the pre-drop level for 5 seconds, when the resolution switches up, or after 120 seconds. It’s severe if a freeze or a resolution drop happened inside it.
What the card says. Bitrate before → lowest, max packet loss, NACK / PLI counts, RTT before → max, the layer change and how long the resolution took to come back. A real line from our validation run: “bitrate 1 069 → 99 kbps, 2 freezes, layer 540p → 270p”.
- Likely cause: “Network between you and the sender: channel estimate fell 2.4 → 0.4 Mbit/s.” or “…: packet loss spiked to 6.2 %.”
- Check: “Wi-Fi/VPN on this machine. If it happens to everyone at once — SFU or the sender's uplink.”
Where to look in your solution.
- Find whose link it is. Open the Report’s Other streams on this page. If every incoming stream dropped together, it’s this viewer’s downlink. If only the tested one dropped, look at that sender’s uplink or the SFU. Two testers on different networks settle it in one call.
- Read NACK against PLI. Many NACKs and few PLIs mean retransmission is repairing the loss. Many PLIs mean the decoder lost its references and asked for keyframes, and each keyframe is a bitrate burst on a link that’s already struggling. Check that RTX is negotiated in the SDP; the JSON export has it in full.
- Watch the Recovery row. A 10-second drop followed by 40 seconds at 360p isn’t the network any more. It’s the SFU’s layer-switching policy, or bandwidth probing being too cautious on the way back up. Our guide to WebRTC bandwidth estimation explains how that probing works.
- Check the sender’s degradation strategy. Under a bandwidth limit the encoder trades resolution, frame rate or sharpness according to
degradationPreference. Set it per content type:maintain-framerateorbalancedfor cameras,maintain-resolutionfor screen share, or set the track’scontentHinttomotion/detailand let Chrome choose.
4. Connection path changed · Network
What the viewer notices. Often nothing at first. Then more delay, a short quality dip or a brief freeze around the switch.
How StreamTest catches it. Chrome switches the selected ICE candidate pair, and the events band gets a Path → relay circle. It becomes a problem if the new path goes through a TURN relay, or if the median round trip in the 10 seconds after the switch is at least 1.5 times the median before it. A switch to a non-relay path is judged 10 seconds later and dated back. Switches within 3 seconds count as one.
What the card says. The old and new path (for example “srflx→srflx · udp → srflx→relay · tcp”), RTT before → after, average loss after the switch, and the TURN server’s host:port.
- Likely cause: “The direct path failed; media now goes through a TURN relay (tcp).”
- Check: “UDP blocked or Wi-Fi roaming? Expect +72 ms delay while on relay.”
Where to look in your solution.
- Relay over TCP or TLS is the expensive case. Every lost packet is retransmitted by TCP and holds back everything behind it, so delay jumps on any loss. Offer TURN over UDP first and keep TCP/TLS on port 443 as the fallback for locked-down networks.
- Put TURN where your users are. A relay on another continent adds its round trip to every packet. Run TURN in several regions and hand each client the nearest one.
- The same office every time? A corporate firewall that blocks UDP forces every call onto relay. Give the customer’s IT team the exact ports and ranges your media servers and TURN use.
5. Reconnection · Network
What the viewer notices. Video and audio stop together, the app shows “reconnecting,” and the call either comes back or drops.
How StreamTest catches it. The ICE connection state goes to disconnected or failed after it had been connected. ICE notices an outage only 5–7 seconds after the packets stop, so StreamTest dates the start back to the last packet that arrived. The problem ends when ICE is connected again and a green Reconnected event appears. If the connection isn’t back within 30 seconds, the problem closes as not recovered and the session turns Disconnected. A reconnection is always severe.
What the card says. How long the stream was down, the ICE state sequence and the path after recovery. Real one-liners from our stand: 8.0 s for an 8-second blackout, 30.0 s, not recovered for a 40-second one.
- Likely cause: “The connection to the sender was lost for 8.0 s.”
- Check: “Network drop on this machine (Wi-Fi, VPN, sleep) or on the sender's; if all participants reconnected at once — the SFU.”
Where to look in your solution.
- Everyone at the same second means the server. Test two or three participants at once. A simultaneous reconnection points to the SFU: a restart, an overloaded node, a load balancer timing out UDP flows, a rescheduled container. Our stabilisation playbook for video conferencing at scale covers the server side.
- Check when your client restarts ICE. Chrome reports
disconnectedwithin seconds, butfailedcan take about 30 seconds without a response. Apps that wait forfailedbefore callingrestartIce()turn a network switch that could recover in a few seconds into a 30-second outage. If the old path is gone for good, restart ICE ondisconnectedafter a short grace period. - Look at the path after. If the call came back on a relay, the direct path is gone for good: the network changed under the call.
Video freeze: where frames stopped
To find why a WebRTC video froze, compare the frames received, decoded and painted during the freeze: nothing received means the network delivered nothing, received but not decoded means a decoder stall, and decoded but not painted means the page or the video element. StreamTest does this for you. A Video freeze opens when no new frame is painted for one second or more while the tab is visible and the video is playing, and it’s severe from three seconds. Then StreamTest works out where the frames stopped, checking the causes in this order:
| Cause | Rule | Category |
|---|---|---|
page | A main-thread task of 200 ms or more overlaps the freeze | Page |
network | In the 3 s before: loss ≥ 2 % or bitrate under half its median; or no packet arrived on the connection for 2 s during the freeze | Network |
decoder | Frames kept arriving at half the usual rate or more, but under 10 % were decoded | Device |
element | Frames were decoded at half the usual rate or more, but not painted | Device |
unknown | None of the above | Device |
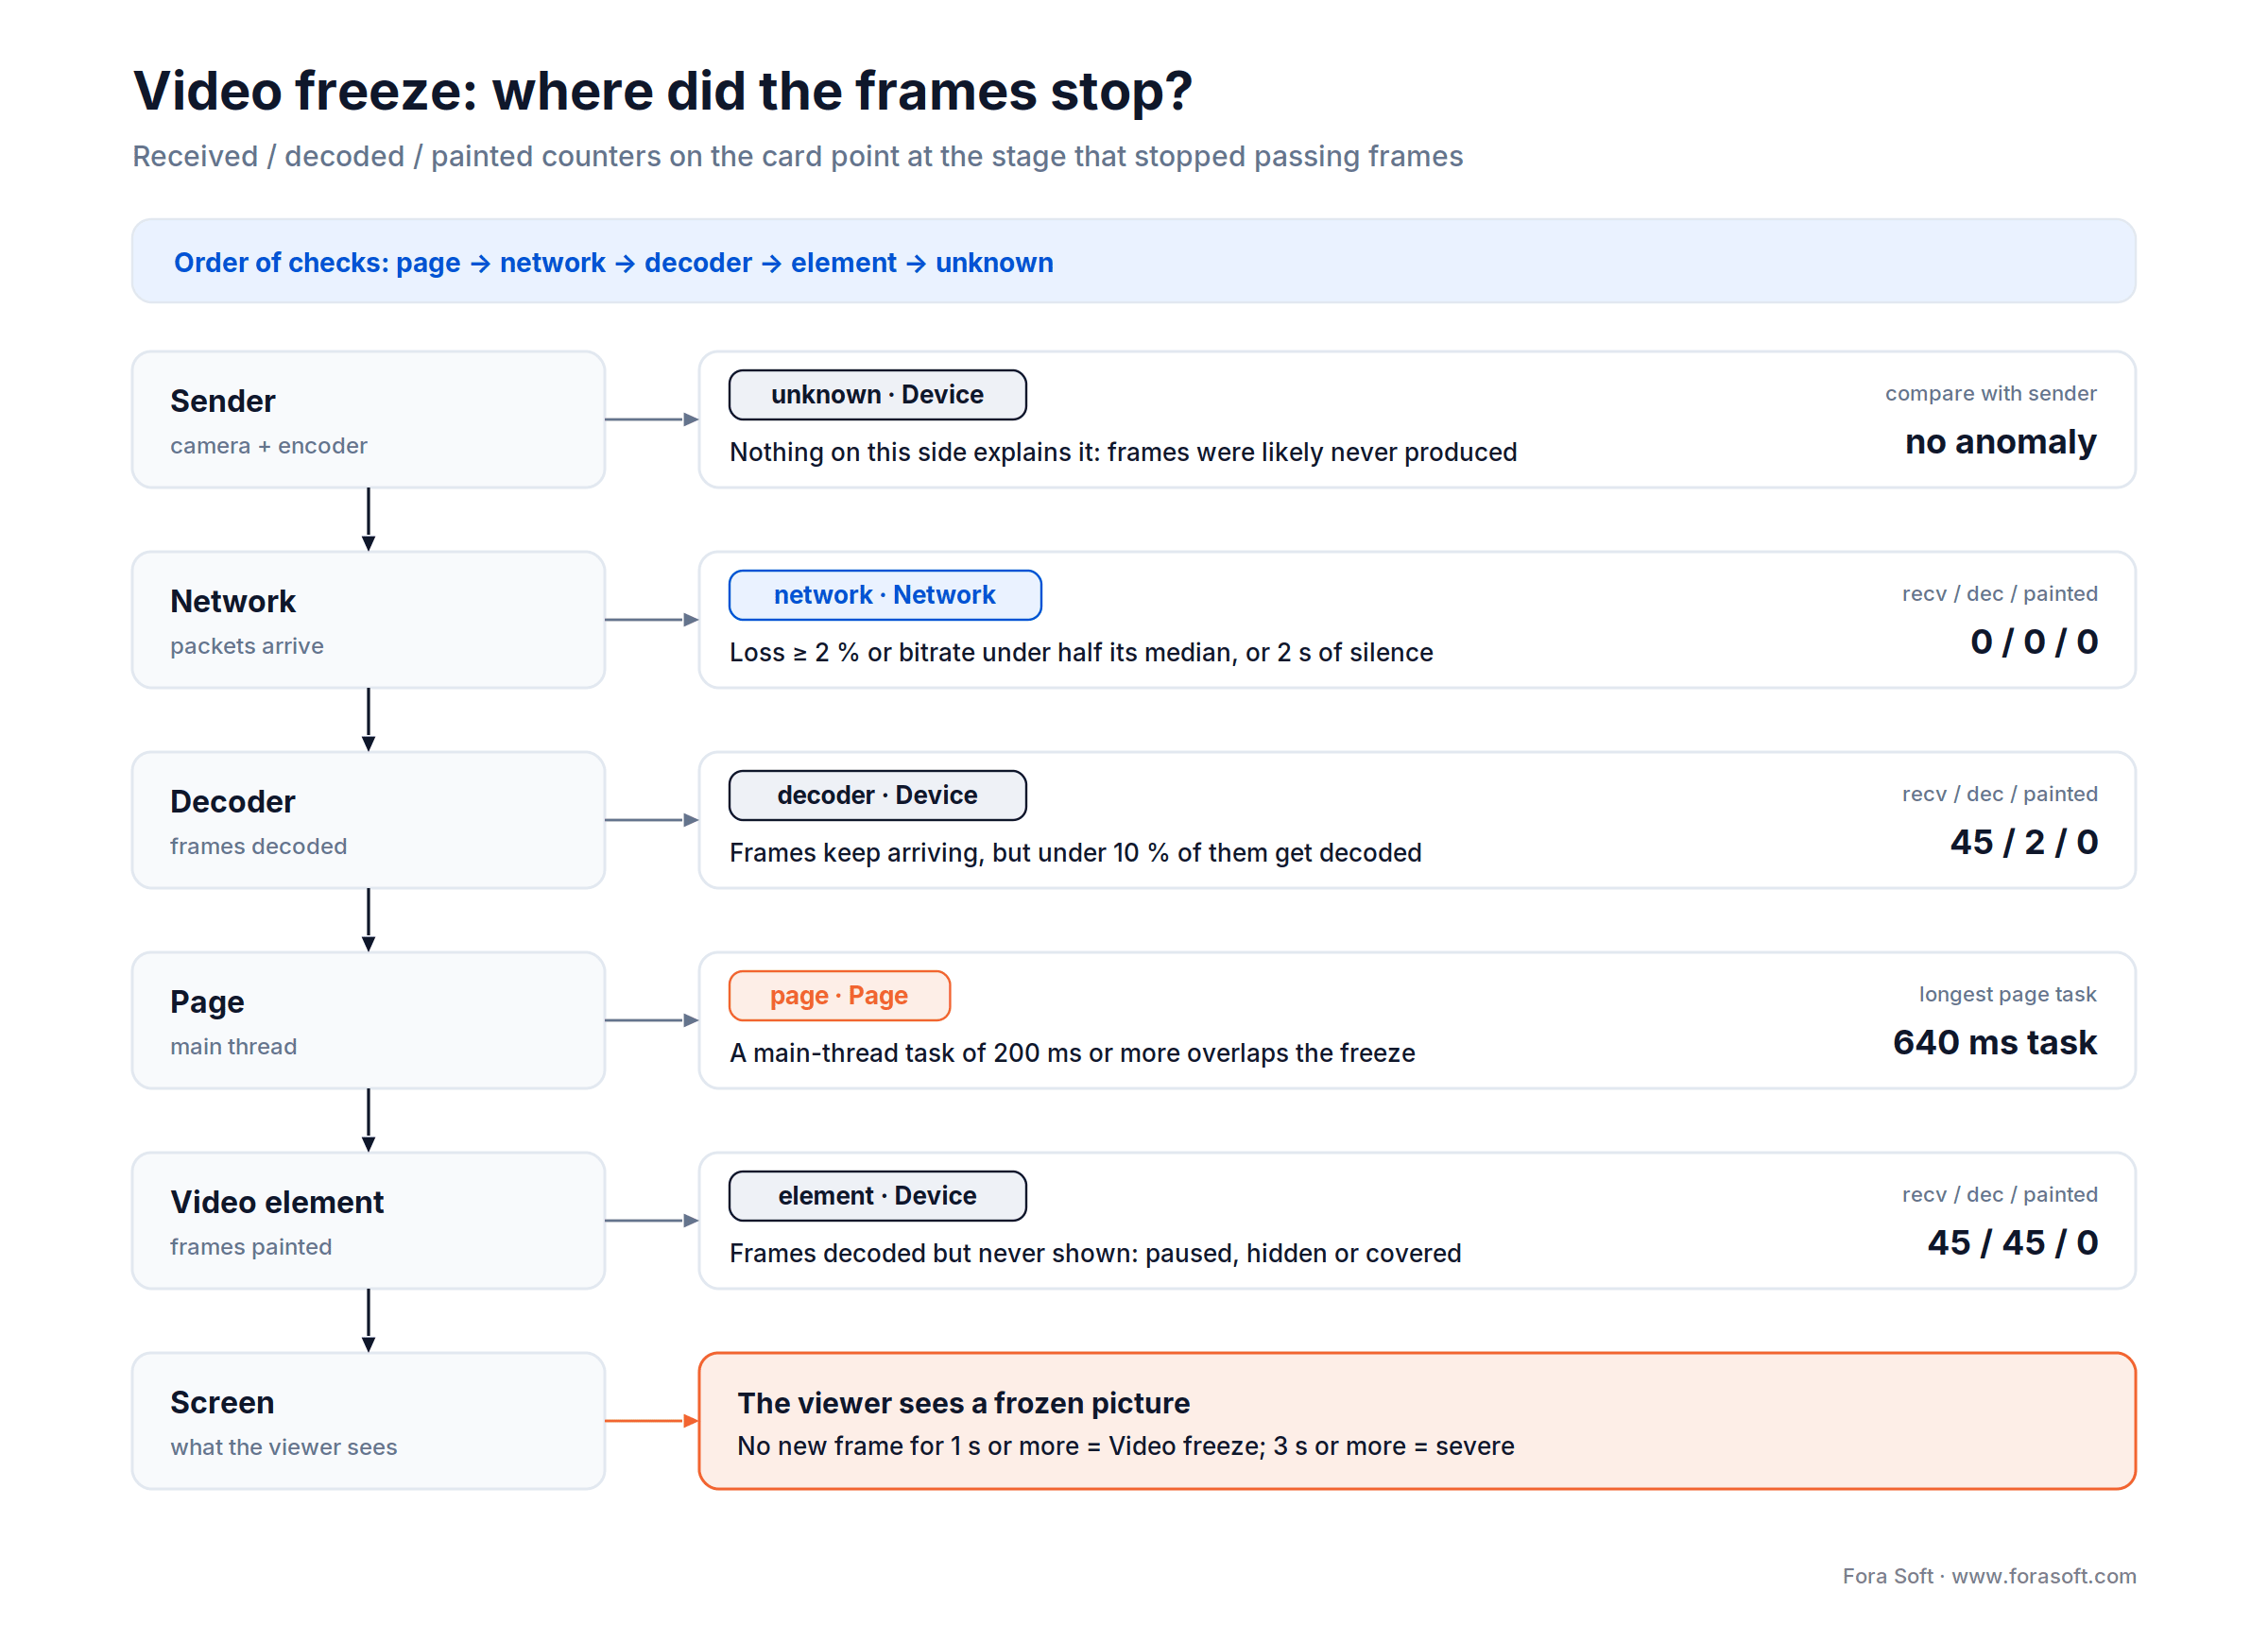
Figure 6. A freeze read like an X-ray: the three frame counters on the card show which stage stopped passing frames on.
What the card says. Duration; frames received / decoded / rendered during the freeze; loss and bitrate just before it; and the longest page task. The one-liner is short: 3.0 s, network.
| Cause | Likely cause | Check |
|---|---|---|
page | “The page's JavaScript blocked the main thread for 640 ms; the browser could not paint.” | “Profile the page's main thread around 1:02.” |
network | “Packets stopped arriving: loss 4.1 %, bitrate fell to 96 kbps.” | Same as Bandwidth drop. |
decoder | “Frames arrived but the decoder produced none — decoder stall.” | “Decoder: …; try disabling hardware decoding.” |
element | “Frames were decoded but the video element did not show them.” | “Is the element paused, hidden, or covered? readyState was 4.” |
unknown | “No network or page anomaly around the freeze.” | “Compare with the sender's side at 1:40.” |
Where to look in your solution.
- Read the frame counters first.
0 / 0 / 0means nothing reached this browser.45 / 2 / 0points at the decoder.45 / 45 / 0means the page never let the frames reach the screen. - Don’t trust 0 % loss during a short outage. Chrome repairs a 2–3-second blackout with retransmissions, so the loss counter barely moves. That’s why StreamTest also watches for silence on the connection, and why a
networkfreeze can show loss near zero. - Decoder stalls are hardware-specific. The JSON export names the decoder implementation. Reproduce with hardware decoding off (
chrome://flags/#disable-accelerated-video-decode); if the freeze disappears, you have a GPU or driver issue, often triggered by mid-stream resolution changes. - An element freeze is a front-end bug. Look for code that pauses the
<video>, hides it with CSS, moves it off-screen or covers it with another layer while the participant grid re-renders. - Unknown means ask the sender. Nothing on this side explains it, so the frames most likely were never produced: a stalled camera, a throttled sender tab, or a screen share of a static slide that only sends frames when the content changes.
For how freezes and quality switches feel to viewers, and how they’re scored, see our Learn article on switching and freezing artifacts.
Page, device and sender problems
Four problems aren’t tagged Network. Page jank and audio/video drift show up on the receiving machine; an upload limit and a blurry picture start at the sender. The received stream’s network charts usually stay flat through them, and that flatness is the clue.
3. Page jank · Page
What the viewer notices. The video stutters while the connection is fine, and the rest of the interface feels sluggish at the same moment.
How StreamTest catches it. The browser reports a main-thread task of 200 ms or longer. In that second or the next, frame rate drops below 70 % of its 10-second median, while packet loss stays under 1 % and bitrate stays at 80 % of normal or higher. Tasks less than a second apart merge into one problem. Seconds with a hidden tab or a paused video are never judged.
What the card says. The mini chart turns into bars, one per long task, with a dashed line at 50 ms. Below it: the longest task, frame rate before → during, and loss, bitrate and RTT marked normal.
- Likely cause: “The page's JavaScript, not the stream: the main thread was busy for 420 ms while the network was fine.”
- Check: “Performance profile of the page around 1:02; heavy DOM updates or timers.”
Where to look in your solution.
- Know when jank can touch video at all. Chrome paints a plain
<video>without the main thread, so a busy page alone doesn’t stop it. Jank reaches the picture when your JavaScript is in the video path: canvas or WebGL rendering, background blur and virtual backgrounds, frame processing with insertable streams, or your own camera preview and sender in the same tab. - Profile the exact second. Reproduce with a DevTools Performance recording running and press Mark when it happens. The card gives you the
m:ssof the task, so you can go straight to it in the flame chart. - Usual suspects in video apps. The whole participant grid re-rendering on every audio-level or stats update, large synchronous JSON parsing of signaling messages, chat history rendering, analytics SDKs, and layout thrashing when tiles resize.
- Move media work off the main thread. OffscreenCanvas and
MediaStreamTrackProcessorboth work in a worker, and throttling UI updates from volume meters to a few per second removes a classic source of long tasks.
8. Audio / video out of sync · Device
What the viewer notices. Lips don’t match the words. Viewers are far less tolerant of sound that runs ahead of the picture than of sound that lags behind it.
How StreamTest catches it. It compares when this browser plays out the audio and the video of the same moment at the sender. An offset above 200 ms for 3 seconds opens the problem; below 120 ms for 3 seconds closes it. Chrome reports these playout times only for audio and video it synchronizes itself, which means tracks of one MediaStream, and only 6–10 seconds after connecting. Without them the detector stays silent rather than guessing.
What the card says. The offset and its direction (audio ahead by 340 ms), the video and audio jitter buffers, and the video delay.
- Likely cause: “The video jitter buffer grew to 1240 ms while the other stayed at 60 ms.”
- Check: “If it started after a freeze or a layer change — recovers on its own; if constant — sender timestamps.”
Where to look in your solution.
- One stream, or no lip-sync at all. Chrome aligns audio and video only when the SDP puts them in the same stream (the same stream id in
a=msid). If your SFU signals them separately, users get no lip-sync and StreamTest can’t measure it. - A constant offset is a timestamp bug. Lip-sync relies on RTCP Sender Reports that map each track’s RTP clock to one wall clock. An SFU that rewrites timestamps or forwards stale reports breaks sync for the whole call.
- A temporary offset usually heals itself. After a freeze or a layer switch one buffer grows, and the synchronizer needs a few seconds to catch up. Act only if it repeats.
6. Your upload limited by CPU or bandwidth · Sender
What the viewer notices. This one is about how others see you. In a two-way call, the people receiving your video get a lower resolution or frame rate than your camera captures.
How StreamTest catches it. Chrome reports why it’s holding back your outgoing video: the qualityLimitationReason of the top layer. If the reason is cpu or bandwidth for 3 seconds in a row, the problem opens; it closes after 3 seconds without a limit. The title names the reason that lasted longer.
What the card says. The reason, sent vs requested bitrate, the resolution and frame rate actually sent, and the encoder implementation. The encoder name appears only when the page has camera or microphone permission. From our stand: “bandwidth, 2 s, 144 of 1 700 kbps”.
| Reason | Likely cause | Check |
|---|---|---|
| CPU | “This machine cannot encode 1280×720 in real time (libvpx).” | “Close other apps; lower the capture resolution; check that hardware encoding is used.” |
| Bandwidth | “Your uplink cannot carry 1 700 kbps.” | “Uplink speed on this machine; other uploads running?” |
Where to look in your solution.
- Software encoders are expensive. VP8, VP9 and AV1 in software, especially with SVC at 720p and above, will saturate an older laptop. Offer a hardware-friendly profile (often H.264) or a lower capture size for weak devices. Our piece on AV1 in production covers the encode-cost trade-off.
- Effects compete with the encoder. Background blur, virtual backgrounds and noise suppression run on the same CPU as encoding. Measure them together, not one at a time.
- Simulcast multiplies the upload. Three layers mean three encodes and the sum of three bitrates. Set
maxBitrateper layer withRTCRtpSender.setParameters()and drop the top layer for small rooms. - Uplinks are the narrow side. Home and mobile connections upload far slower than they download. Compare the requested figure on the card with what the user’s uplink really delivers.
9. Blurry picture · Sender
What the viewer notices. The stream claims full resolution, yet faces are smeared and text is unreadable. The network looks perfectly healthy.
How StreamTest catches it. It reads the quantization parameter (QP): how coarsely the sender’s encoder compressed each frame. Higher QP means fewer bits per frame and a blurrier picture. The problem opens when QP stays in the red zone for 5 seconds while bitrate holds at 80 % of its 30-second median and no Bandwidth drop is going on. It closes after 5 seconds out of the red zone.
| Codec | Green up to | Red above |
|---|---|---|
| H.264 | 30 | 38 |
| VP8 | 50 | 80 |
| VP9, AV1 | 100 | 160 |
Chrome usually leaves QP out for received VP9, so on VP9 streams this detector stays silent.
What the card says. Median QP with the codec and its limit, bitrate at the resolution, and the layer. From our stand: “QP 106 at 1080p, bitrate 262 kbps”.
- Likely cause: “The sender encodes 1920×1080 at only 262 kbps — too little for this resolution.”
- Check: “Sender's encoder settings or SFU layer selection; the network is fine.”
Where to look in your solution.
- Bitrate caps that no longer match the resolution. A
maxBitrateinsetParameters(), ab=ASline or anx-google-max-bitrateparameter in the SDP, chosen for 720p and left in place after capture moved to 1080p. - Simulcast layer configuration. A top layer that scales to full resolution with a bitrate meant for a middle layer is a classic cause.
- The SFU’s choice. The SFU forwards a high-resolution layer to a receiver whose bandwidth budget can’t feed it. A lower layer at a healthy QP looks better than a starved high one.
- Degradation preference.
maintain-resolutionnever lowers the pixel count: under pressure it drops frame rate, and whatever bitrate is still missing shows up as high QP. That’s right for screen sharing and usually wrong for faces.
Audio stutter and slow start
The last two problems are the ones users describe in the most human words: “robotic voice” and “I stared at a black tile.” Both are Network problems, and both cards come with a quick split test built in.
7. Audio stutter · Network
What the viewer notices. Robotic, choppy or metallic speech, missing syllables. Users forgive a soft picture; they don’t forgive broken audio.
How StreamTest catches it. When audio packets are late or missing, the decoder invents sound to fill the gap. StreamTest tracks the share of these concealed samples over a 5-second window. Above 5 % the problem opens; below 2 % for 5 seconds it closes. It’s severe when the peak goes above 20 %.
What the card says. Peak concealment, audio packet loss, audio jitter and the audio jitter buffer, all as maximums over the problem.
- Likely cause: “Audio packets arrived late or not at all: loss 12.0 %, jitter 38 ms.”
- Check: “Same network checks as Bandwidth drop; if video was fine at the same time — audio-only path or sender microphone pipeline.”
Where to look in your solution.
- Compare with video at the same second. If video suffered too, it’s the shared network path: follow the Bandwidth drop checks. If video was clean, audio took a different route, such as a separate audio mixer or server, or the sender’s microphone pipeline is struggling.
- Check the loss protection in the SDP. Opus in-band FEC (
useinbandfec=1, defined in RFC 7587) and, where your stack supports it, redundant audio (RED) help speech survive random loss. The JSON export contains the full SDP of both sides. - Jitter without loss is a buffering story. High jitter with low loss means packets do arrive, just unevenly. Look for queueing on the path: Wi-Fi contention, a busy uplink at the sender, bufferbloat on home routers. Our Learn primer on bandwidth, jitter and loss goes deeper.
10. Slow start · Network
What the viewer notices. They join the call and stare at a black tile or an avatar for several seconds before the other person appears.
How StreamTest catches it. It measures from the start of the stream to the first painted frame. The start is the moment the page applied the remote description that brought the video, if that happened up to 15 seconds before the test and no frame had been shown yet; otherwise it’s the moment the test started. Over 4 seconds is a warning, over 8 is severe, and no frame in 15 seconds closes the problem as no video in 15 s. If the video was already playing when you started the test, the start isn’t judged at all.
To measure join time, right-click the participant’s tile as soon as it appears, before the picture shows up. StreamTest counts back to the moment the stream was negotiated.
What the card says. First frame, ICE connected at, first packet at, and the path, all in seconds from the start of the stream.
| Situation | Likely cause |
|---|---|
| ICE took more than 3 s | “ICE took 5.20 s to connect through a relay.” |
| Connected fast, frame came late | “Connected in 0.40 s but the first frame came 5.72 s later — waiting for a keyframe from the sender.” |
| Connected, still no frame | “Connected in 0.40 s but no frame came in 14.60 s — waiting for a keyframe from the sender.” |
| ICE never connected | “ICE did not connect in 15.00 s.” |
Check: “TURN configuration and UDP; keyframe request handling on the sender/SFU.”
Where to look in your solution.
- Split the wait in two. ICE time is connectivity; the gap between connection and first frame is the media pipeline. The card shows both, so you know which team to call.
- Slow ICE. STUN or TURN addresses in your configuration that time out, TURN credentials fetched only after the call starts, candidates not trickled, a relay-only policy, a relay far from the user.
- Fast ICE, late frame. The decoder needs a keyframe to start. When a new subscriber joins, the SFU must request one from the publisher right away, and the publisher must answer. Aggressive keyframe-request throttling on the SFU is a frequent culprit.
- Track it every release. The Report’s Distribution table shows the first-frame time of every session against a 4-second target, even when no problem was raised. Why that target matters is covered in our Learn article on time to first frame.
When the test won’t start
If StreamTest can’t pick a stream, it says why: a red line on the start screen shows one of three messages, and each has a short fix.
| Message | What it means | What to do |
|---|---|---|
| “No video under the cursor. Right-click directly on a participant's video.” | No <video> with a live media stream at the point you clicked | Right-click over the video itself. Open iframe-embedded calls in their own tab. HLS and DASH players aren’t WebRTC and are out of scope |
| “No WebRTC connection found for this video. It may not be a WebRTC stream, or it was created before the page loaded.” | The video has a stream, but no WebRTC connection on the page carries it | You clicked your own preview, the video comes from a canvas or a file, or the call started before StreamTest was active: reload and rejoin |
| “This site does not allow reading connection statistics.” | The page refused the statistics request | Nothing to fix from the browser; test a build of the service where statistics are available, such as staging |
Other situations worth knowing
- No “Test stream” in the menu. The site draws its own right-click menu, so Chrome’s menu, and StreamTest’s item in it, never appears.
Stream disconnected · 2:14. The track ended, the connection closed, the page swapped the video’s stream, ICE didn’t recover in 30 seconds, or statistics failed three times in a row. Everything recorded stays; the Timeline shows “Stream disconnected at 2:14. Data kept.” with a Pick another stream button.- A grey dash with “This website doesn’t allow testing…”. That value isn’t available for this stream, for example audio delay on a video-only stream.
- Long calls. The session keeps the last 60 minutes of per-second data. Beyond that the Report says “Showing the last 60 min of 1:12:30”.
- Leaving the page. The session lives in the page’s memory. Export it before you navigate away; only the short summary for the next “previous run” comparison survives.
From finding to ticket
The Report turns a session into something a developer can act on without a call: a verdict in one sentence, every problem with its card, percentiles for each metric, and files with the raw data. Open it from the Report tab or by clicking the status row.
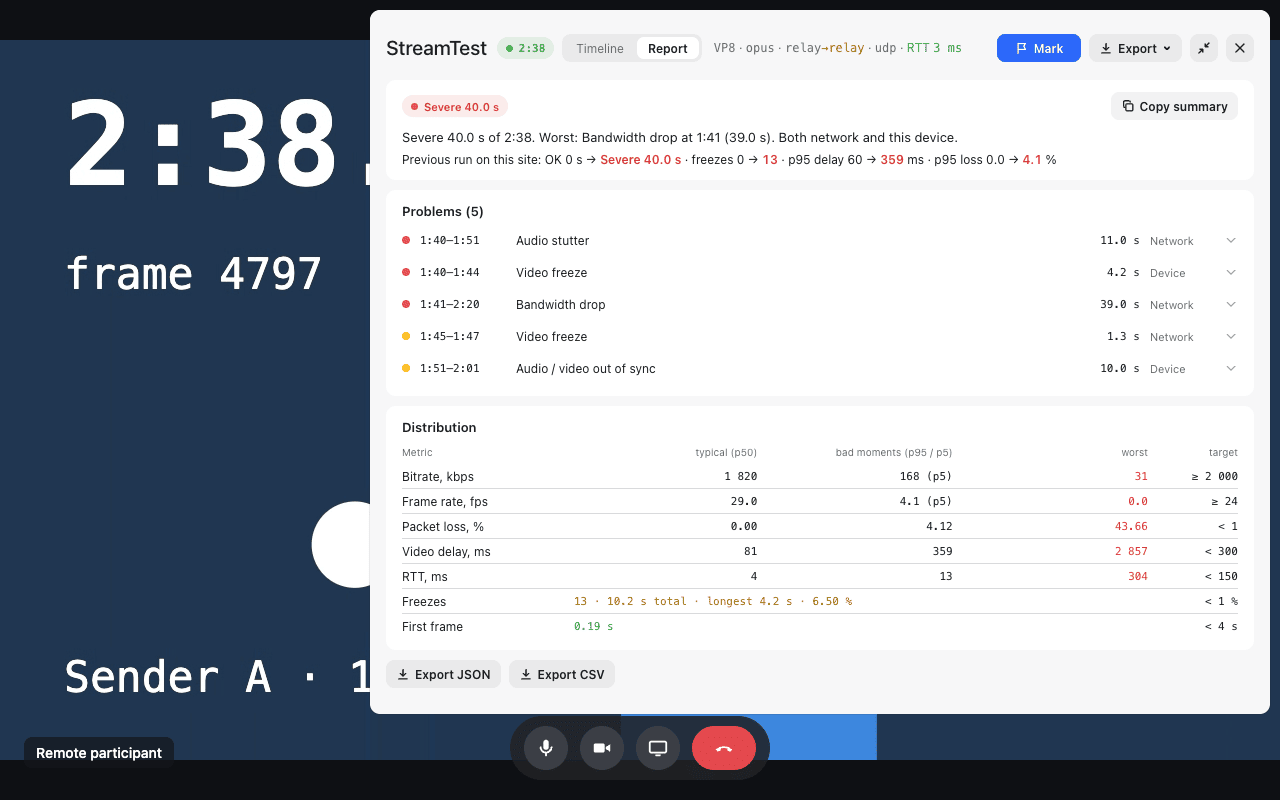
Figure 7. The Report after a throttled run: the verdict, the comparison with a clean previous run, five problems and the Distribution table.
The verdict card and the previous run
The first line is the summary you’d write yourself: “Severe 40.0 s of 2:38. Worst: Bandwidth drop at 1:41 (39.0 s). Both network and this device.” Below it, StreamTest compares this session with the previous run of at least 30 seconds on the same site. Improvements are green, regressions red:
“Previous run on this site: OK 0 s → Severe 40.0 s · freezes 0 → 13 · p95 delay 60 → 359 ms · p95 loss 0.0 → 4.1 %”
That makes a one-line regression check: run the same call on yesterday’s build and today’s, and read the difference.
Worked example: why 65.5 seconds of problems read “Severe 40.0 s”
The run in Figure 7 raised five problems: Audio stutter 1:40–1:51 (11.0 s), Video freeze 1:40–1:44 (4.2 s), Bandwidth drop 1:41–2:20 (39.0 s), a second Video freeze 1:45–1:47 (1.3 s) and Audio / video out of sync 1:51–2:01 (10.0 s). Add the durations and you get 11.0 + 4.2 + 39.0 + 1.3 + 10.0 = 65.5 seconds.
But the viewer didn’t suffer for 65.5 seconds. Together the intervals cover 1:40 to 2:20 without a gap (the Bandwidth drop alone spans 1:41–2:20), so their union is 40 seconds, and that’s the number on the chip. Against a 2:38 session (158 s), 40 ÷ 158 ≈ 25 % of the call was degraded, and because the Bandwidth drop was severe, the verdict is Severe. Counting overlaps once is what makes the verdict comparable between runs: five small problems stacked in one bad moment don’t outrank one long outage.
Problems and Distribution
Every problem from the session is listed with its interval, duration and category; click a row to unfold its card in place. The Distribution table then shows how the whole session felt, not just its worst moments:
| Column | Meaning |
|---|---|
| typical (p50) | The median: what the stream was like most of the time |
| bad moments (p95 / p5) | The worst 5 %: p95 for loss, delay and RTT, p5 for bitrate and frame rate |
| worst | The single worst value, colored by the thresholds |
| target | The green threshold for that metric |
Freezes get one line with their count, total and longest duration and share of time; the first-frame time is measured against the 4-second target. If the page receives more than one video, Other streams on this page lists each one with resolution, bitrate, loss and freezes. It’s the quickest way to tell a problem with one sender from a problem with your own connection.
Copy summary: the ticket body in one click
Copy summary puts a plain-text digest on the clipboard. For example:
StreamTest — meet.example.com — 2026-09-24 14:05 — 2:00
Degraded 12.7 s. Network, not the page.
Problems (2):
  0:38–0:48  Bandwidth drop (9.7 s) — bitrate 1 800 → 610 kbps
  1:16–1:19  Connection path changed (3.0 s) — → relay · udp, RTT 46 → 118 ms
Bitrate p50 1 520 kbps (p5 640) · Frame rate p50 29.8 (p5 24.1) · Loss p95 3.90 % · Delay p95 212 ms · RTT p95 118 ms · Freezes 0 / 0.0 s / 0.00 %
Codecs H264 / opus · Path srflx→relay · udp · First frame 1.84 s
Export: the evidence
| File | What’s inside | Use it for |
|---|---|---|
| JSON: full session | Every per-second sample, events and marks, problems with their card texts, percentiles, connection details, the local and remote SDP, other streams, the previous run | Attaching to a ticket, deep analysis, feeding your own tooling |
| CSV: per-second samples | One row per second with every metric, then the events and problems | Spreadsheets and quick charts |
Download logs in the Compact header saves the JSON in one click. An hour-long session is about 1.5 MB.
A good StreamTest ticket has three parts: the copied summary in the description, the JSON attached, and your marks referenced by number, such as “Mark 2 at 1:14: the user said the picture froze.”
Reach for the JSON export when: the card alone doesn’t settle it, or the developer needs the SDP to check RTX, FEC or bitrate caps. It holds everything the panel saw. One caution: the SDP contains network addresses, so share the file the way you’d share any network log.
Playbooks for four teams
The same panel serves very different jobs. These are the routines we recommend, from a one-minute demo to a release gate.
Try it in one minute, without your own app
- Open the WebRTC sample page peerconnection/pc1, a call the page makes to itself.
- Click Start, allow the camera, then Call.
- Right-click the right-hand video, the received stream, and choose Test stream.
- Open the Timeline, press Mark, then click Hang up on the page and watch the status change to
Stream disconnected.
QA: a release regression run
- Fix the scenario: the same site, network and devices, and a 2–3 minute script: talk, screen share, a participant joins and leaves.
- Start the test the moment the remote tile appears, so the first-frame time is measured too.
- Press Mark at every script step and note the numbers: Mark 1 = screen share on, Mark 2 = third participant joins.
- Pass criteria: no Severe verdict; typical frame rate ≥ 24 fps; p95 video delay under 300 ms; freezes under 1 %; first frame under 4 s.
- Read the Previous run on this site line against the last release and attach the JSON to the release ticket.
Support: “the video keeps freezing”
- Ask the customer to install StreamTest. It’s free, needs no account and sends nothing anywhere, which makes the request easy to accept.
- Join a test call; the customer right-clicks your video and chooses Test stream.
- Ask them to press Mark every time they see a freeze.
- After a few minutes they click Copy summary and paste it into the chat, then send the JSON.
- Route by the verdict’s last sentence, as in Figure 8.
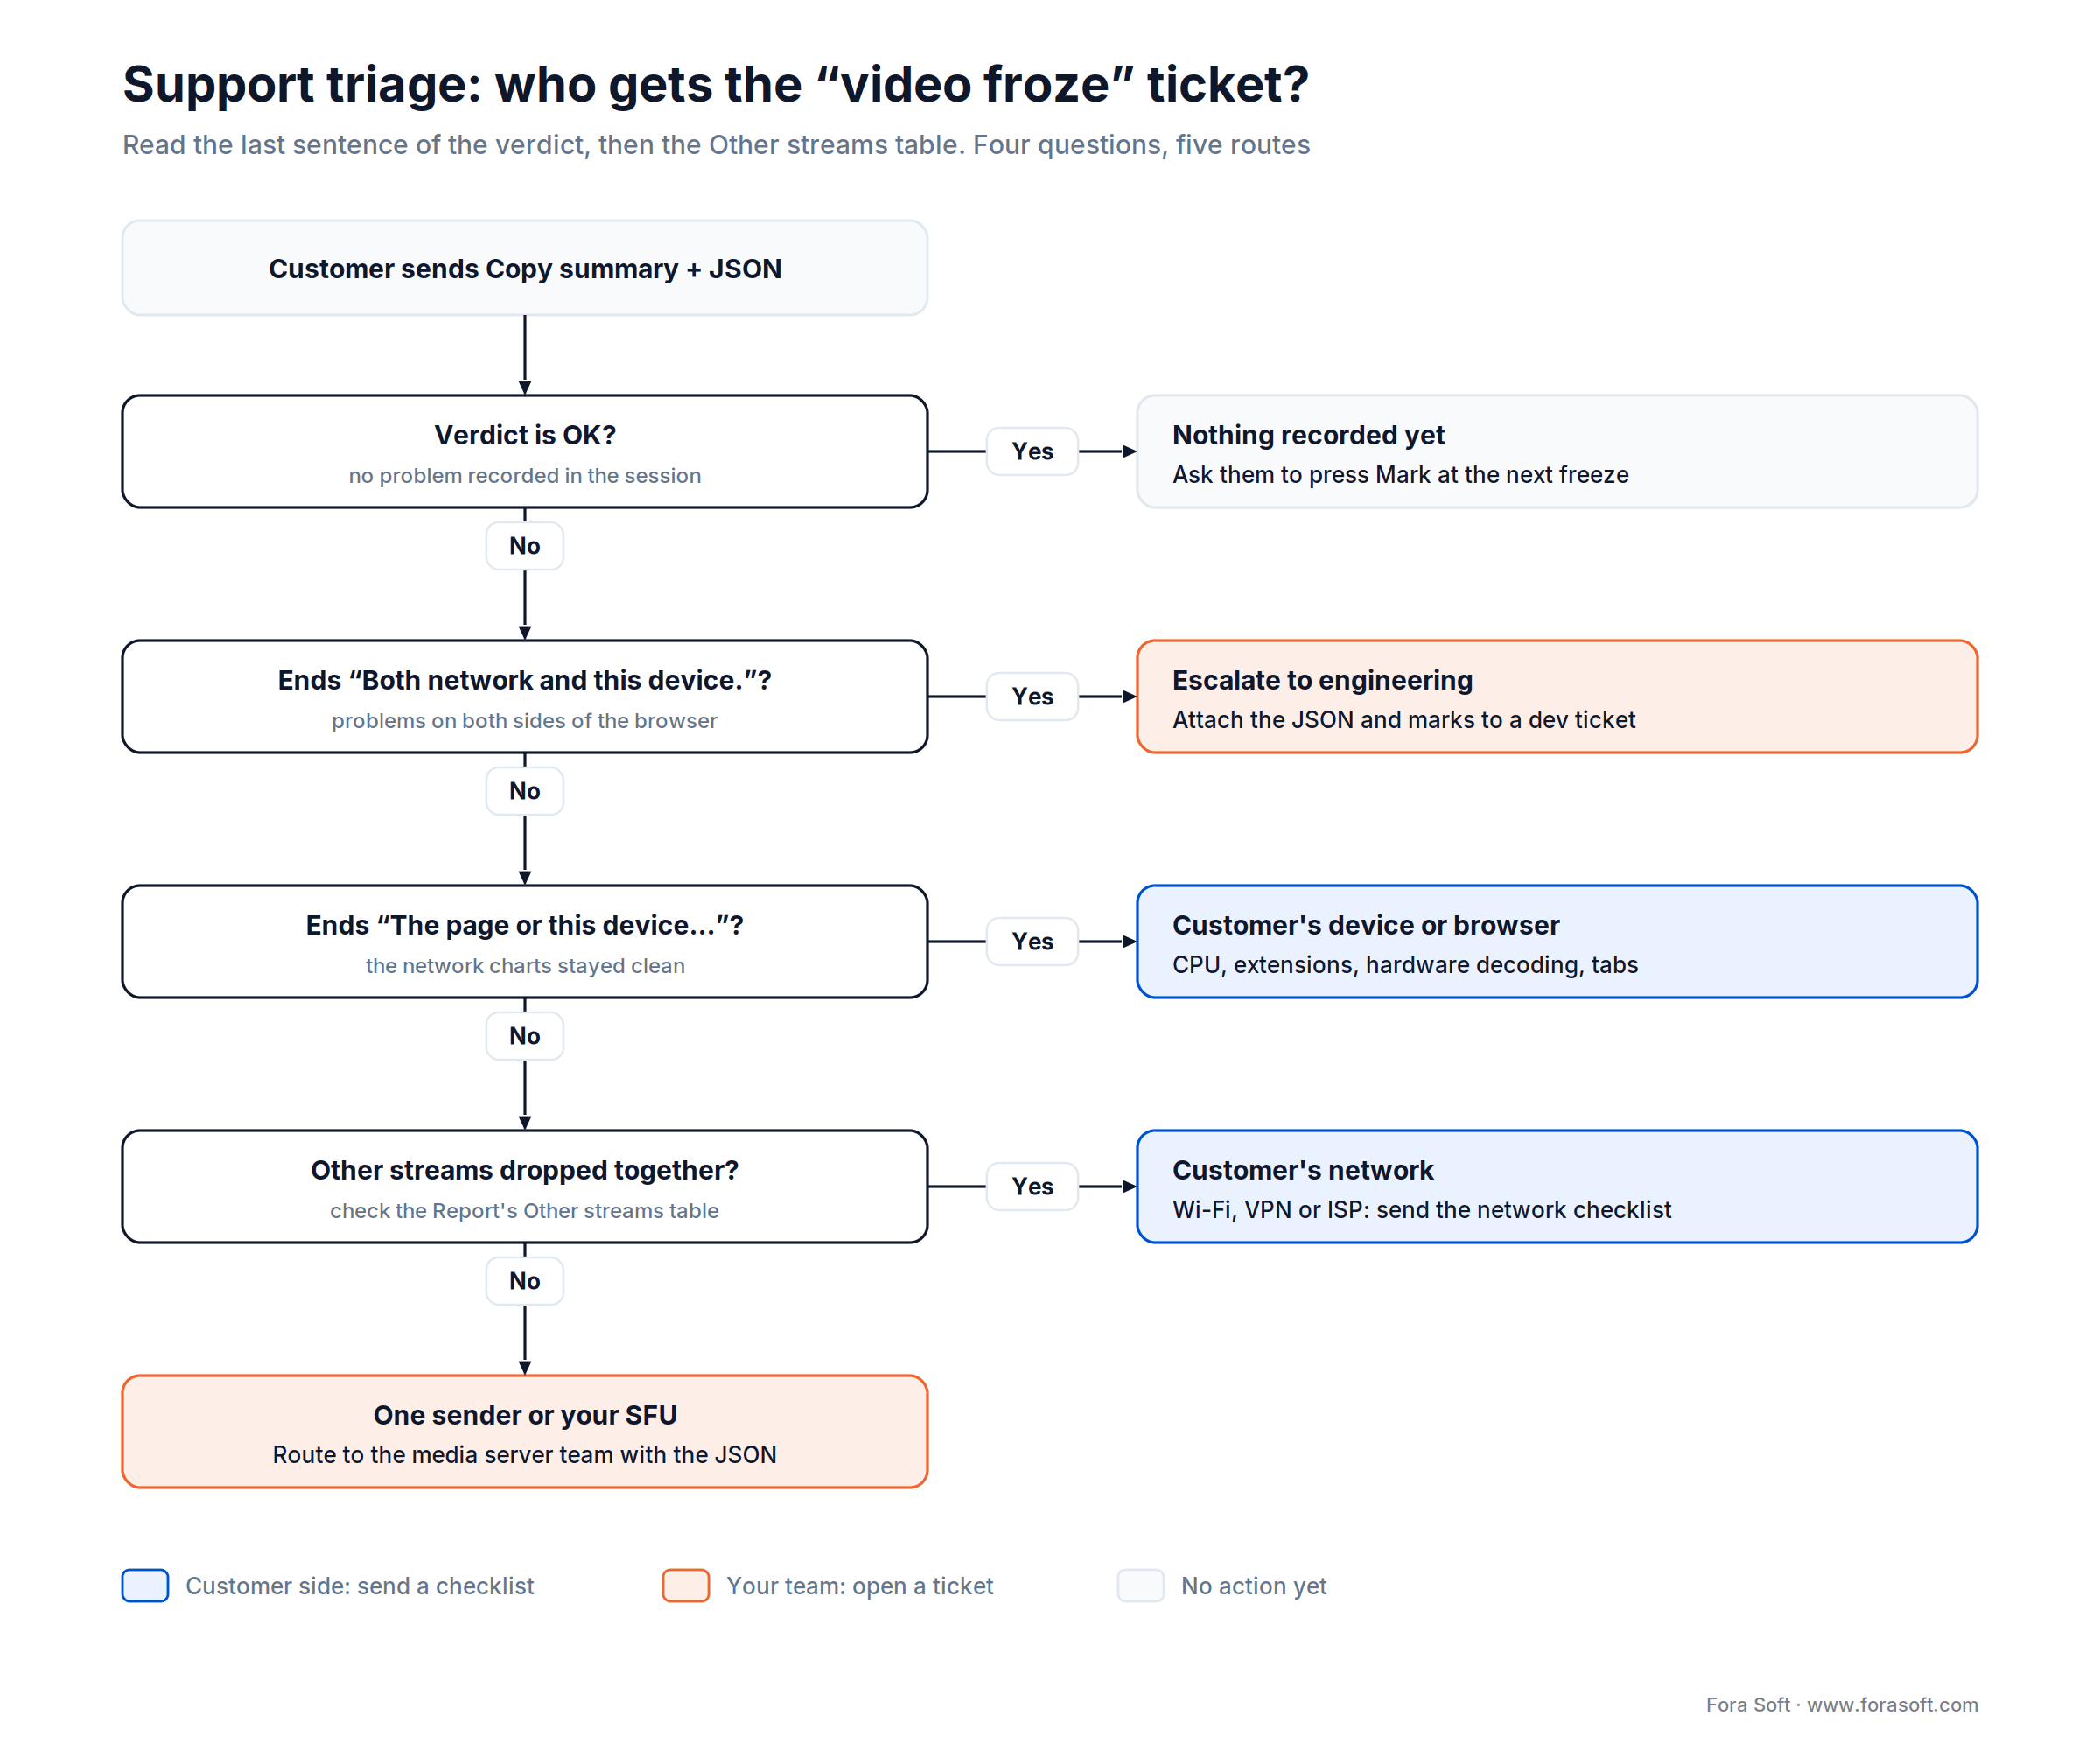
Figure 8. Support triage in four questions. The last sentence of the verdict plus the Other streams table decide who gets the ticket.
Network, not the page. points at their Wi-Fi, VPN or ISP, and Other streams tells you whether it’s only your stream. “The page or this device, not the network.” points at their browser, decoder, CPU or extensions. Both network and this device. goes to escalation with the JSON attached.
Developers: reproduce, then debug
StreamTest runs on http://localhost and http://127.0.0.1, so you can test a development build before it ever reaches staging.
- Shape the network below the browser. DevTools’ built-in presets were made for HTTP. Since Chrome 124, custom throttling profiles add packet loss, queue length and reordering for WebRTC, which is fine for a quick look. For faults you can repeat exactly, shape the traffic outside the browser: Network Link Conditioner on macOS,
tc netemon Linux or clumsy on Windows. Our stand shapes the traffic on its own TURN server, which makes loss, throttling and blackouts repeatable. - Test both directions. Open two participants and run StreamTest in each window. A problem visible on one side only is half of the diagnosis.
- Script it from the console.
window.__vttexposes the latest session, also after it ended:
| Call | Returns |
|---|---|
__vtt.state() | idle, live, disconnected or stopped |
__vtt.sample() | The latest per-second sample |
__vtt.series("v_bitrate", 60) | The last 60 values of a field |
__vtt.problems(), __vtt.events() | Problems with their cards, events and marks |
__vtt.streams() | Other streams on the page |
__vtt.export("json") | Downloads the session file |
await __vtt.debug.perf() | The extension’s own load on the page, checked against its budget |
Reach for a network shaper when: you need the same fault twice, for a before-and-after on a fix or a regression test in CI. A shaped 300 kbit/s cap for 10 seconds gives the same Bandwidth drop card every time; a flaky office Wi-Fi never will.
Product and engineering leads: compare setups
The previous-run comparison works for any A/B test, not only releases. Run the same scenario with VP8 and then AV1, with the SFU in Frankfurt and then in Virginia, with simulcast on and then off. The second Report shows the difference in degraded seconds, freezes, p95 delay and loss; the CSV exports go straight into a spreadsheet for the rest. If you’re weighing topologies rather than settings, our P2P vs SFU vs MCU guide is the place to start.
Mini-case: proving it on a stand
The situation. A detector that guesses wrong is worse than no detector. If a card says “network” when the page was the culprit, the ticket goes to the wrong team with a confident label on it, and the real bug hides for another sprint. So before StreamTest went to the Chrome Web Store, we needed proof that every card names the right problem and the right cause, and not only on a good day.
The plan. We built every detector together with a test stand: a WebRTC call that runs inside one page, a “Truth” panel that computes the key numbers independently, and buttons that reproduce each fault. Network faults are real, shaped on the traffic through a TURN server: throttling, packet loss, blackouts, blocked UDP. Page jank, CPU overload, a blurry encoder and a late first frame are staged the same way. The release bar was strict: the cause on the card must match what the stand did in at least 9 of 10 runs.
The result. In the final validation, 15 scenario checks were each repeated ten times without retries: 150 runs, and every one named the right problem and cause, 10 out of 10 per scenario. The numbers in this guide come from those runs: a 10-second throttle to 300 kbit/s took bitrate from 2,185 to 31 kbps with loss peaking at 43.7 %; an 8-second blackout produced an 8.0 s Reconnection; a 40-second one closed as 30.0 s, not recovered. Want the same fault-injection rigor applied to your own product before release? Book a 30-minute call and we’ll sketch the stand for your stack.
StreamTest vs chrome://webrtc-internals
chrome://webrtc-internals shows every raw counter of every WebRTC connection on the page and leaves the interpretation to you; StreamTest watches one received stream and tells you in words what went wrong, when, and who should fix it. So use both. We still open webrtc-internals every week, just after StreamTest has told us which second and which counter to look at.
| chrome://webrtc-internals | StreamTest | |
|---|---|---|
| What you get | Raw counters and graphs for every connection | Ten named problems with cause and checks, for the stream you picked |
| Frame rate | Frames decoded | Frames painted on screen |
| Delay | Separate counters to add up yourself | One number, split into network, buffer and decode |
| Where it lives | A separate browser tab | A panel over the call |
| Who can read it | WebRTC experts | QA, support and developers alike |
| Output | A dump for experts | A ticket summary, JSON and CSV |
Where each number lives in getStats and webrtc-internals
Every StreamTest number is built on the standard W3C WebRTC Statistics API, plus signals getStats() doesn’t have: painted frames, main-thread long tasks, tab visibility and the connection events StreamTest hooks (remote description, ICE state). If you want to cross-check a card in webrtc-internals, these are the report types and fields to look at:
| StreamTest shows | Look in webrtc-internals for |
|---|---|
| Frame rate | inbound-rtp framesPerSecond is the decoded rate; painted frames come from requestVideoFrameCallback and aren’t in getStats |
| Packet loss | inbound-rtp packetsLost and packetsReceived (deltas over 5 s) |
| Bitrate, resolution | inbound-rtp bytesReceived (delta per second), frameWidth, frameHeight |
| Video delay | candidate-pair currentRoundTripTime; inbound-rtp ΔjitterBufferDelay ÷ ΔjitterBufferEmittedCount and ΔtotalDecodeTime ÷ ΔframesDecoded (per-second deltas: lifetime ratios hide spikes) |
| Channel estimate (dashed line) | candidate-pair availableIncomingBitrate, when Chrome reports it |
| NACK / PLI | inbound-rtp nackCount, pliCount |
| Audio stutter | inbound-rtp (audio) concealedSamples ÷ totalSamplesReceived |
| Upload limited | outbound-rtp qualityLimitationReason |
| Blurry picture | inbound-rtp qpSum ÷ framesDecoded |
| A/V sync | inbound-rtp estimatedPlayoutTimestamp for the audio and the video track |
| Connection chip | selected candidate-pair, then local-candidate candidateType and relayProtocol; remote-candidate candidateType |
How to use chrome://webrtc-internals alongside StreamTest
- Open
chrome://webrtc-internalsin a second tab before you start the call, so its graphs cover the whole session. EachRTCPeerConnectionon the page gets its own section with the API trace (offer/answer, ICE candidates) and a stats table per report type. - When StreamTest raises a problem, note its start time and open the matching connection’s
inbound-rtpgraphs for the fields in the table above. - Before you close the call tab, expand Create a WebRTC-Internals dump and download the PeerConnection updates and stats data; the page forgets a connection once its tab is gone. Attach the dump next to the StreamTest JSON.
- In Firefox the equivalent page is
about:webrtc; StreamTest itself runs only in Chrome.
Under the hood, and why nothing leaves your browser
StreamTest does all its work inside the page you test and makes no network requests of its own: no server, no analytics, no web fonts. A small script wraps RTCPeerConnection as the page loads, getStats() runs once a second on the tested connection (every five seconds on the others, for the Other streams table), requestVideoFrameCallback reports every painted frame, and PerformanceObserver reports long main-thread tasks. Samples of about fifty fields sit in a 60-minute ring buffer, and the ten detectors run on every new second.
The budget is strict: at most one getStats() call per second on the tested connection, at most one panel render per second (four for frame rate) and no more than 8 MB of memory for an hour-long session; await __vtt.debug.perf() checks it live. Extension storage keeps only the panel size and a short previous-run summary per site, with no addresses, media or page content. StreamTest asks for four permissions: the context menu item, access to the active tab when you click, scripting to pass that click to the page, and storage.
Reach for chrome://webrtc-internals when: you need a counter StreamTest doesn’t surface, a connection other than the one you tested, or the full API trace of offer/answer and ICE candidate gathering. Take the dump, and use StreamTest’s problem timestamps to know where in it to look.
Want a stand that breaks your calls on purpose?
We build WebRTC products and the test rigs that prove them. In 30 minutes we’ll map the faults worth reproducing for your stack and what fixing each one costs.
Which tool: five questions
StreamTest is one tool in a WebRTC kit, and it’s the right one for a specific job. Five questions settle whether that job is yours.
Q1. Is the stream WebRTC, received in desktop Chrome 116+? HLS or DASH players, native apps and Safari are out of StreamTest’s reach.
Q2. One call, or ten thousand? StreamTest explains one session in depth; a fleet needs production monitoring that collects getStats() from every client.
Q3. Before the call or during it? A pre-call troubleshooter checks camera, microphone and TURN reachability before anyone joins; StreamTest judges the stream you actually receive once the call runs.
Q4. Can you reproduce it? Yes: the QA or developer playbook with a network shaper. Only at the customer: the support playbook, where the customer runs the test and you read the summary.
Q5. A named problem or a raw counter? A named problem with an owner: StreamTest. A counter nobody surfaces, on a connection nobody tested: chrome://webrtc-internals.
| Your situation | Reach for |
|---|---|
| A customer says “it froze” and you need the owner | StreamTest, support playbook |
| Release regression check on one scenario | StreamTest, QA playbook + previous-run line |
| A raw counter on any connection, or the offer/answer trace | chrome://webrtc-internals dump |
| Camera, mic and TURN check before anyone joins | A pre-call WebRTC troubleshooter, such as the open-source testrtc |
| Hundreds of simulated participants | A load-testing tool; see our WebRTC testing guide |
| Quality across every production call | Client-side getStats() collection and a monitoring backend |
| The card points at your SFU, TURN or encoder | Our troubleshooting and optimization team: that’s the part we fix |
When not to use StreamTest
We’d rather you pick the right tool than blame the wrong one. StreamTest is the wrong tool in these cases:
- HLS, DASH and progressive players. They aren’t WebRTC, so there’s no peer connection to read, and StreamTest will say so.
- Anything but desktop Chrome. It’s built and tested for Chrome 116+. Safari, Firefox and native iOS or Android apps are out of reach; other Chromium browsers can install it, but we don’t test them.
- Load and fleet questions. One browser watching one stream won’t tell you what happens at 500 participants or across every production call. Use a load tool, or client-side stats collection with a monitoring backend.
- Calls you can’t right-click. Sites that replace Chrome’s context menu, cross-origin iframes you can’t open in their own tab, and pages that refuse statistics requests all block a test. Staging builds usually don’t.
- The sender’s encoder internals. From the receiving side StreamTest sees the result (QP, resolution, frame rate), not the encoder’s decisions. Test on the sender’s machine or read its webrtc-internals dump.
FAQ
What is StreamTest?
StreamTest is a free WebRTC troubleshooter for Chrome from Fora Soft that diagnoses one received WebRTC video stream during a call. Right-click a participant’s video, choose Test stream, and it shows live metrics, names ten types of problems with a likely cause and checks, and exports a report as a summary, JSON or CSV.
Is StreamTest free, and does it send my data anywhere?
StreamTest is free, with no account or sign-up, and it makes no network requests of its own: statistics are read and processed in the page, and extension storage keeps only your panel size and a short summary of the previous run per site. Files are created only when you click Export or Download logs.
How is StreamTest different from chrome://webrtc-internals?
webrtc-internals shows every raw counter of every connection and leaves the interpretation to you. StreamTest watches one stream, applies fixed thresholds and ten detectors, and tells you in words what went wrong, when, whose side it’s on and what to check. Use StreamTest to find the second and webrtc-internals to inspect it.
Why does StreamTest show a lower frame rate than webrtc-internals?
webrtc-internals reports frames decoded; StreamTest counts frames actually painted on screen through requestVideoFrameCallback. When rendering can’t keep up (page JavaScript in the video path such as canvas, WebGL or effects, or an overloaded GPU), a stream can decode 30 fps while the viewer sees 12, and StreamTest reports the 12.
Does StreamTest work with Google Meet, Zoom or Microsoft Teams?
StreamTest works on any HTTPS page where the call is WebRTC in a video element and Chrome’s own right-click menu appears. We don’t certify third-party apps, and some replace the context menu or render video differently. The quickest check is to right-click a participant: if Test stream appears and data starts after five seconds, you’re set.
Why is there no Test stream item when I right-click the video?
Usually the site draws its own right-click menu, so Chrome’s menu never appears and neither does StreamTest’s item. The item is also missing on pages StreamTest doesn’t run on: anything other than HTTPS, the root page of an HTTP site, or localhost. If the menu appears but the test won’t start, reload the page with StreamTest on and rejoin, since the extension hooks WebRTC connections as the page loads.
Can StreamTest test my own camera or outgoing video?
StreamTest measures received streams, so right-clicking your own preview won’t work. It does report when your outgoing video is limited by CPU or bandwidth (the Your upload limited problem); to see how others receive you, run StreamTest on another participant’s browser.
Does StreamTest work in Firefox, Safari or Edge?
StreamTest is built and tested for desktop Chrome 116 or newer. Firefox and Safari can’t run it. Other Chromium browsers can install Chrome Web Store extensions, but we don’t test them, so treat any results there as unverified.
How do I attach StreamTest results to a bug report?
A useful WebRTC bug report has three things: a timestamped summary of what the viewer saw, the per-second stats with both SDPs as a file, and marks tying user reports to seconds. In StreamTest, click Copy summary and paste it into the ticket description, attach the JSON from Export or Download logs, and reference your marks by number, such as Mark 2 at 1:14. The JSON holds every per-second sample, events, problems with card texts and both SDPs; it contains network addresses, so share it like any network log.
What is the difference between a stall and a freeze in StreamTest?
A stall is any gap longer than max(3 × average frame interval, interval + 150 ms), which is 183 ms at 30 fps. Stalls under one second add to the Freezes & Stalls percentage; a gap of one second or more becomes a Video freeze problem with its own card and cause.
What to read next
Testing
How to Test WebRTC Stream Quality
The metrics, thresholds and load tools behind StreamTest’s colors.
Architecture
P2P, SFU, MCU, Hybrid: Which WebRTC Architecture?
Pick the topology before you tune the bitrate.
Scaling
Scalable Video Conferencing: Stabilisation Playbook
What to fix on the server once StreamTest points there.
Learn
WebRTC Bandwidth Estimation, Explained
Why bitrate falls and how fast it should come back.
Learn
NAT, STUN, TURN and ICE for WebRTC
What the connection chip is telling you, and why relays cost delay.
Ready to stop guessing why the video froze?
One right-click turns “the video froze” into a named problem with a timestamp, a severity, an owner and a place to look, and nothing leaves the machine. Install StreamTest from the Chrome Web Store, run it on your next call, and keep the problem catalog above open next to the cards.
StreamTest is a free WebRTC troubleshooter, and it stops at the browser on purpose. When a card points past it, to your SFU, your TURN servers or your encoder settings, that’s the work our team does every day. We’ve built video, real-time and AI software since 2005, and we’d be glad to help you fix what StreamTest found.
Send us what StreamTest found
Book a 30-minute call with our video engineers. Bring the summary and the JSON; leave with the first config change to make and what the full fix involves.

